언어 선택

홈 페이지 arrow-right ... arrow-right 분석 소프트웨어 arrow-right 데이터 분석 소프트웨어 arrow-right Sisense

97개의 무료 및 유료 대안을 Sisense에 대한 목록으로 정리했습니다. 주요 경쟁 업체는 Tableau, Power BI입니다. 이 외에도 사용자들은 Sisense와 Qlik Sense, SAP BusinessObjects, Zoho Analytics 간에 비교를 하기도 합니다. 또한 여기서 다른 유사한 옵션을 살펴볼 수 있습니다: 분석 소프트웨어, 데이터 분석 소프트웨어.


Tableau
Subscription Free Free Trial

Tableau는 대화형이며 의미 있는 방식으로 데이터를 분석하고 시각화할 수 있는 강력한 데이터 시각화 및 비즈니스 인텔리전스 도구입니다. 이를 통해 사용자는 다양한 데이터 원본에 연결하고, 대시보드를 만들고, 인사이트를 공유할 수 있습니다.

Power BI
Subscription Free Trial

Microsoft Power Platform의 구성 요소인 Power BI는 사용자가 여러 원본의 데이터를 시각화하고 분석할 수 있도록 지원하는 포괄적인 비즈니스 인텔리전스 및 셀프 서비스 분석 솔루션입니다. 데이터 모델링, 변환 및 고급 분석과 같은 기능을 제공하여 신뢰할 수 있는 단일 데이터 원본을 보장합니다. Microsoft 365 및 기타 인기 있는 앱과 원활하게 통합되는 Power BI는 생산성을 향상하고 의사 결정을 간소화합니다.

Qlik Sense
Subscription Free Free Trial

연관 분석 엔진은 데이터 탐색과 인사이트 발견을 제공합니다. 증강 분석, 시각화, 대시보드, 보고 및 알림을 통해 데이터 기반 의사 결정을 내릴 수 있습니다.

임시보고, 셀프 서비스 데이터 시각화 및 ...을 포함하는 비즈니스 인텔리전스 도구

Zoho Analytics
Subscription Free Free Trial

클라우드와 온프레미스에서 사용할 수 있는 BI 및 분석 플랫폼으로, 기업이 데이터를 인사이트로 전환할 수 있도록 지원합니다. 드래그 앤 드롭 도구를 사용하여 사용자는 보고서, 대시보드 및 KPI를 생성하고 공유할 수 있습니다.

Genesys Cloud CX
Subscription Free Trial

Genesys Cloud CX는 다양한 산업에서 고객 참여를 향상시킵니다. 컨택 센터 및 CRM을 위한 고급 도구를 제공하여 통화 라우팅, 워크플로 관리를 간소화하고 서비스 프로세스를 개선합니다.

Heap
Subscription Free Free Trial

디지털 인사이트 플랫폼은 사용자의 어려움을 파악하고 직관적인 경험을 위해 신속하게 개선하여 고객 경험을 향상시킬 수 있도록 팀의 역량을 강화합니다.

SquaredUp
Subscription Free

SquaredUp은 플러그인 또는 웹 API를 통해 코드 저장소 및 고객 상호작용 시스템을 포함한 여러 데이터 소스와 통합되는 데이터 시각화 플랫폼입니다. 팀은 데이터를 탐색, 분석 및 시각화하여 이해관계자에게 인사이트와 KPI를 제공할 수 있으며, 롤업 아키텍처는 데이터 사일로를 제거하여 엔지니어링, 제품 및 IT 팀에 전체 기술 스택에 걸쳐 통합된 인사이트를 제공합니다.

테일리움 오디언스스트림은 여러 채널의 데이터를 결합하여 실시간으로 오디언스와 소통할 수 있는 고객 데이터 관리(CDP) 플랫폼입니다. 완전한 고객 프로필을 생성하고, 개인화된 상호 작용을 위해 오디언스를 세분화하고, 마케팅 시스템 전반의 데이터를 관리하여 1,300개 이상의 통합 및 머신러닝 기반 예측 분석을 지원함으로써 관련성 높은 고객 경험을 제공합니다.

Solver
Free Trial Subscription

데이터 기반 의사 결정을 위한 실행 가능한 인사이트를 제공하는 클라우드 기반 xFP&A 솔루션입니다. QuickStart 통합은 보고서, 예산 도구 및 Excel 기반 계획에 대한 액세스를 제공합니다.

데이터 분석 및 시각화 솔루션을 제공하는 비즈니스 인텔리전스 플랫폼입니다. 복잡한 데이터 세트를 분석하고 대화형 대시보드를 만들어 비즈니스 성과에 대한 더 나은 인사이트를 얻을 수 있습니다. 또한 데이터 통합, 시각화 및 공유 기능을 포함한 다양한 기능을 제공합니다.

Sisense 플랫폼

Android Android
Linux Linux
iPad iPad
iPhone iPhone
Web-Based Web-Based
Windows Windows

Sisense 비디오와 스크린샷

Sisense 개요

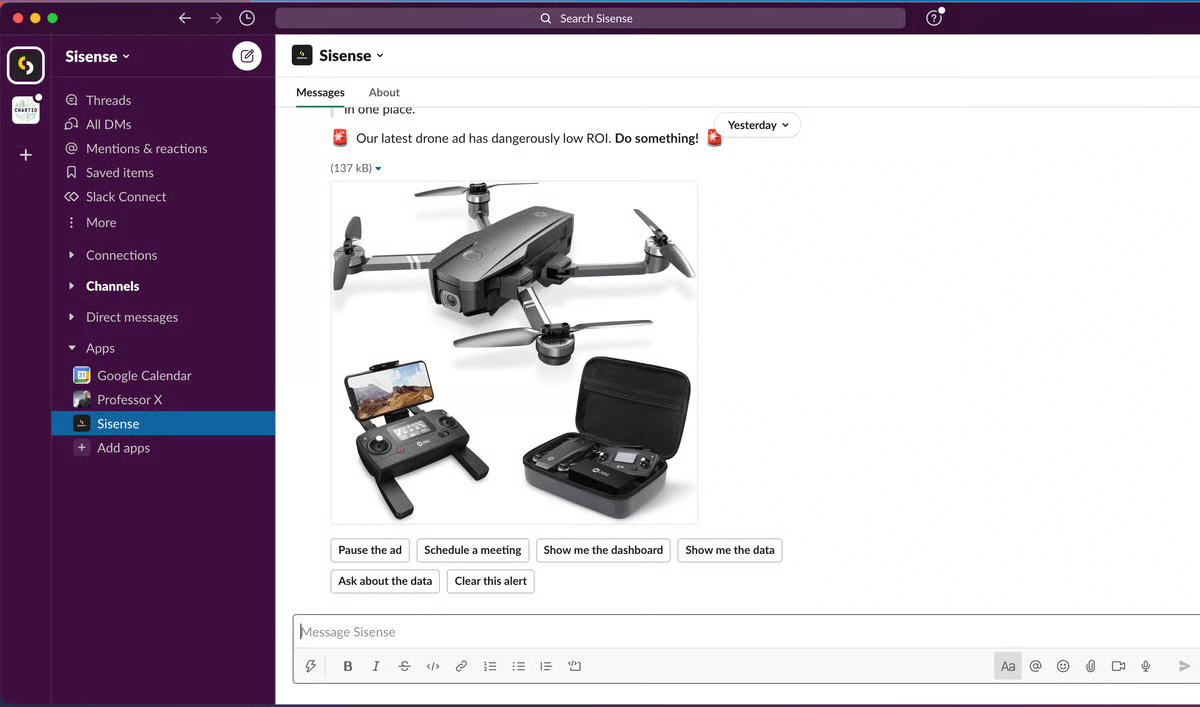
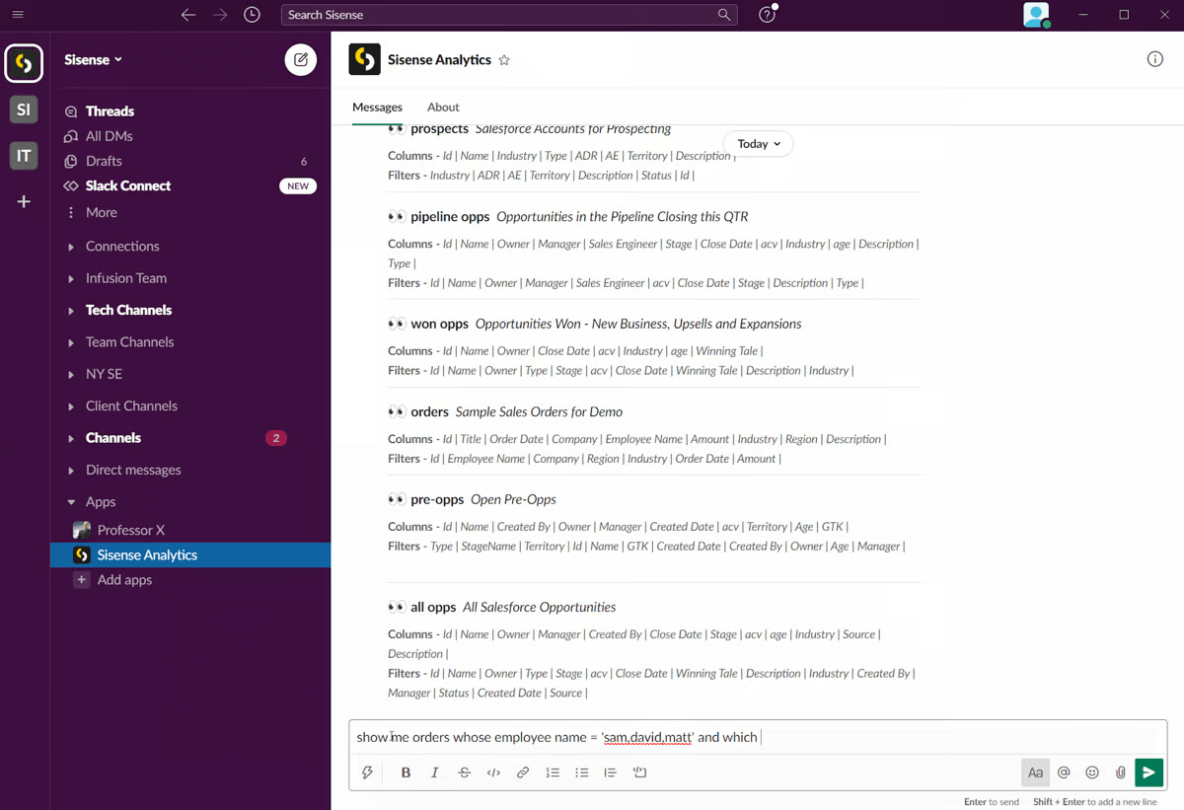
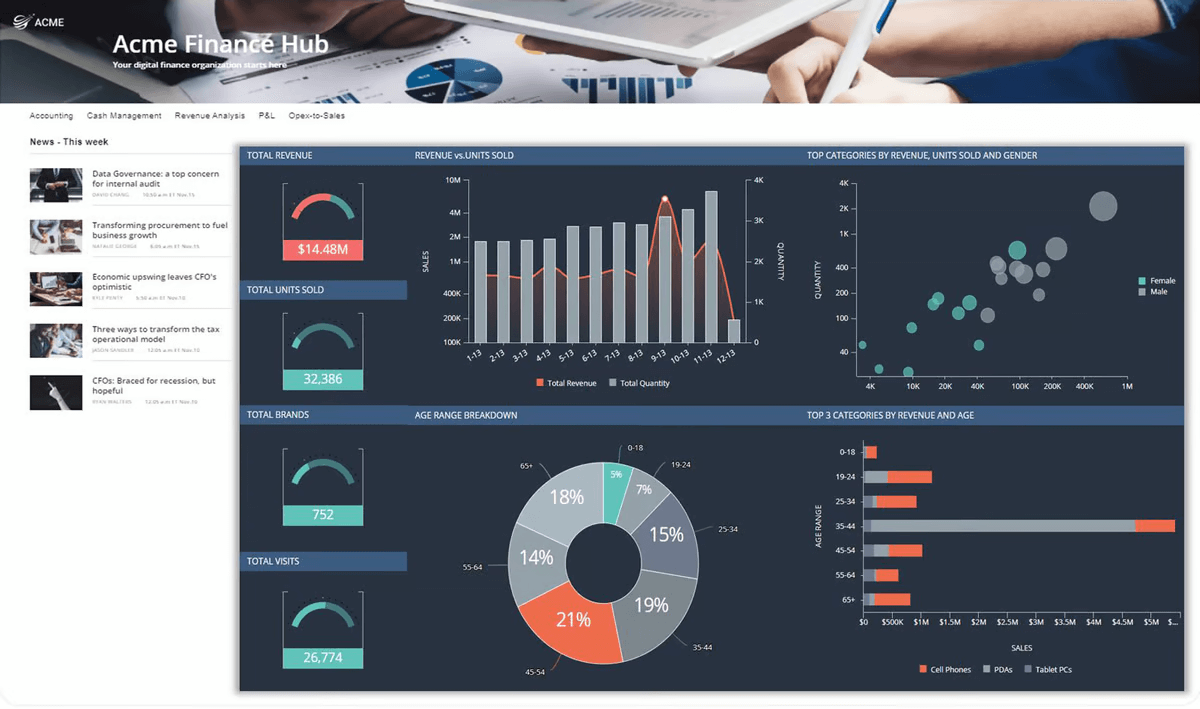
Sisense는 비전문가가 대화 형 대시 보드에서 여러 개의 큰 데이터 세트를 결합, 분석 및 시각화 할 수있는 비즈니스 인텔리전스 및 데이터 분석 소프트웨어입니다.

Sisense 특징

tick-square Third Party Integrations
tick-square Streaming Analytics
tick-square Self-service Analytics
tick-square Relational Display
tick-square Query Builder
tick-square Profitability Analysis
tick-square Predictive Analytics
tick-square OLAP
tick-square No-Code
tick-square Multi-Language
tick-square Modeling & Simulation
tick-square Mobile Reporting
tick-square Media Analytics
tick-square Marketing Reports
tick-square Integration into Third Party Applications
tick-square High Volume Processing
tick-square Financial Reporting
tick-square Employee Self Service
tick-square ETL
tick-square Drag & Drop
tick-square Data Warehousing
tick-square Data Transformation
tick-square Data Quality Control
tick-square Data Import/Export
tick-square Data Cleansing
tick-square Data Blending
tick-square Dashboard
tick-square Customizable Branding
tick-square Conversion Tracking
tick-square Ad hoc Analysis
tick-square Ad hoc Query
tick-square Public Dashboards
tick-square Multiple Data Sources
tick-square For Sales Teams/Organizations
tick-square Geographic Maps
tick-square Key Performance Indicators
tick-square Visual Discovery
tick-square Trend/Problem Indicators
tick-square Time on Site Tracking
tick-square Site Search Tracking
tick-square Scorecards
tick-square Scheduled/Automated Reports
tick-square Private Dashboards
tick-square KPI Monitoring
tick-square Functions/Calculations
tick-square Data Connectors
tick-square Benchmarking
tick-square Keyword Tracking
tick-square Multi-User Collaboration
tick-square Text Analysis
tick-square Chatbot
tick-square Alerts/Escalation
tick-square Strategic Planning
tick-square Referral Tracking
tick-square For Healthcare
tick-square User Interaction Tracking
tick-square Quantitative Analysis
tick-square Qualitative Comparative Analysis
tick-square Pageview Tracking
tick-square Dashboard Creation
tick-square Forecasting
tick-square Widgets
tick-square Process/Workflow Automation
tick-square Self Service Data Preparation
tick-square Data Discovery
tick-square AI/Machine Learning
tick-square Single Sign On
tick-square Visual Analytics
tick-square Real Time Data
tick-square Data Visualization
tick-square Trend Analysis
tick-square Statistical Analysis
tick-square Real Time Analytics
tick-square Real Time Notifications
tick-square Goal Setting/Tracking
tick-square Customizable Dashboard
tick-square Role-Based Permissions
tick-square Collaboration Tools
tick-square Charting
tick-square Customization
tick-square Search/Filter
tick-square Sales Reports
tick-square Performance Metrics
tick-square Monitoring
tick-square Ad hoc Reporting
tick-square Activity Dashboard
tick-square Reporting & Statistics
tick-square Real Time Reporting
tick-square Budgeting/Forecasting
tick-square Alerts/Notifications
tick-square Access Controls/Permissions
tick-square Reporting/Analytics
tick-square Machine Learning
tick-square Interactive Reports
tick-square Audit Trail
tick-square Speech Recognition
tick-square API

소프트웨어에 대한 의견을 공유하고 리뷰를 남겨 더 나아지도록 도와주세요!

Sisense 태그

dashboards business-and-commerce reporting-software analytical-reporting business-analytics data-visualization data-analysis business-intelligence big-data analytics

변경 제안

() out of 5
비교 보기

귀하의 의견

등급을 선택하세요
평점을 선택하세요

Your vote has been counted.

Do you have experience using this software?