Suited for analysts and teams needing advanced data visualization and interactive dashboards. It offers flexible charting and deeper control over visual storytelling, supporting design-rich insights beyond Power BI’s Microsoft-centric structure.
Ideal for teams already embedded in the Google ecosystem. It enables easy connection to Google Sheets, BigQuery, and Ads, offering faster setup for web analytics workflows compared to Power BI’s more enterprise-focused integrations.
Designed for embedding analytics into SaaS products and applications. It offers API-first architecture and in-chip processing, supporting complex data modeling where Power BI is less optimized for OEM use cases.
Best for users needing associative data exploration and self-service dashboards. It allows users to discover relationships across datasets without predefined queries—offering more flexible navigation than Power BI’s structured model.
Suited for data teams focusing on preparation, blending, and advanced analytics. It emphasizes code-free workflows and predictive modeling, handling upstream ETL tasks that Power BI typically delegates to external tools.
Ideal for large enterprises requiring governed, scalable BI across departments. It offers centralized data governance, strong mobile support, and robust security—going beyond Power BI’s mid-market accessibility.
Designed for data scientists building reproducible, statistical dashboards in R or Python. It supports custom analytics and publishing via Shiny or Quarto, addressing advanced modeling use cases outside Power BI’s low-code environment.
SquaredUp is a data visualization platform that integrates with multiple data sources, including code repositories and customer interaction systems, through plugins or a Web API. It enables teams to explore, analyze, and visualize data, providing in…
IBM Cognos Analytics is a comprehensive BI solution that maximizes data potential. It offers advanced reporting, dynamic dashboards, and AI-infused insights for data exploration and predictive forecasting. The platform features robust governance, na…
Oracle Analytics is a cloud-native platform that offers end-to-end analytics capabilities, including data ingestion, modeling, preparation, visualization, and collaboration. Supporting on-premises, cloud, or hybrid deployment to ensure flexible and …
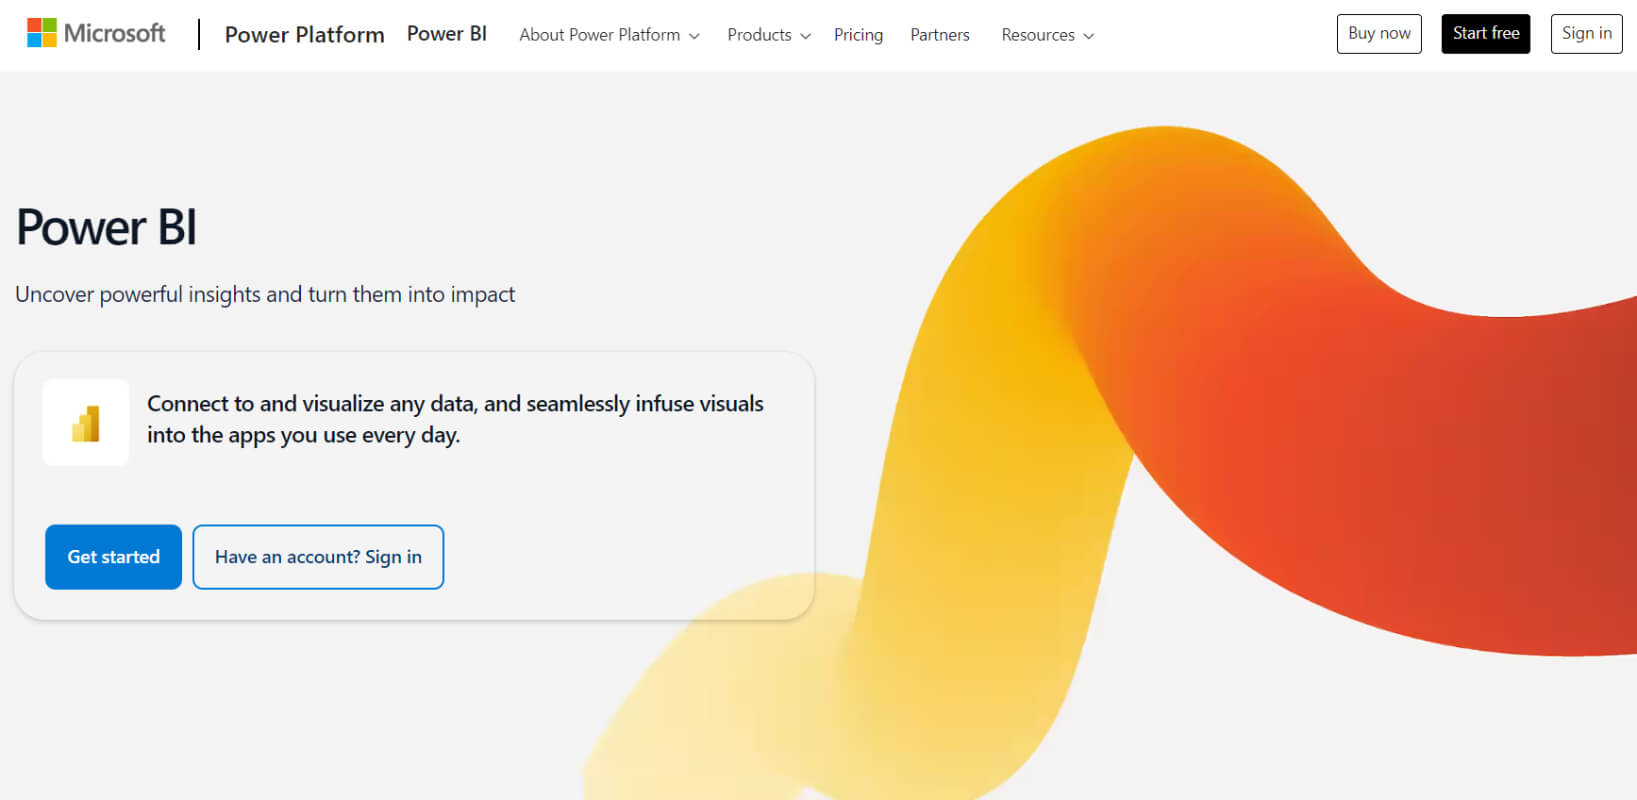
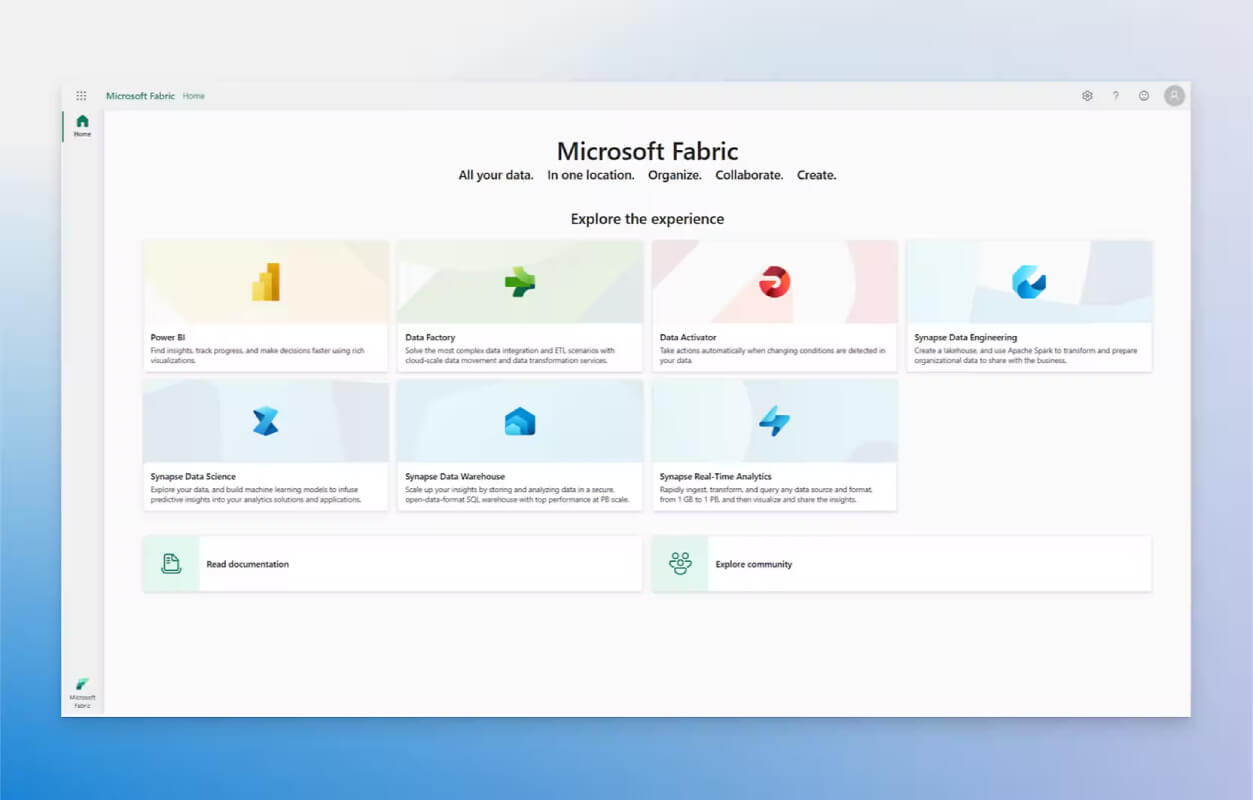
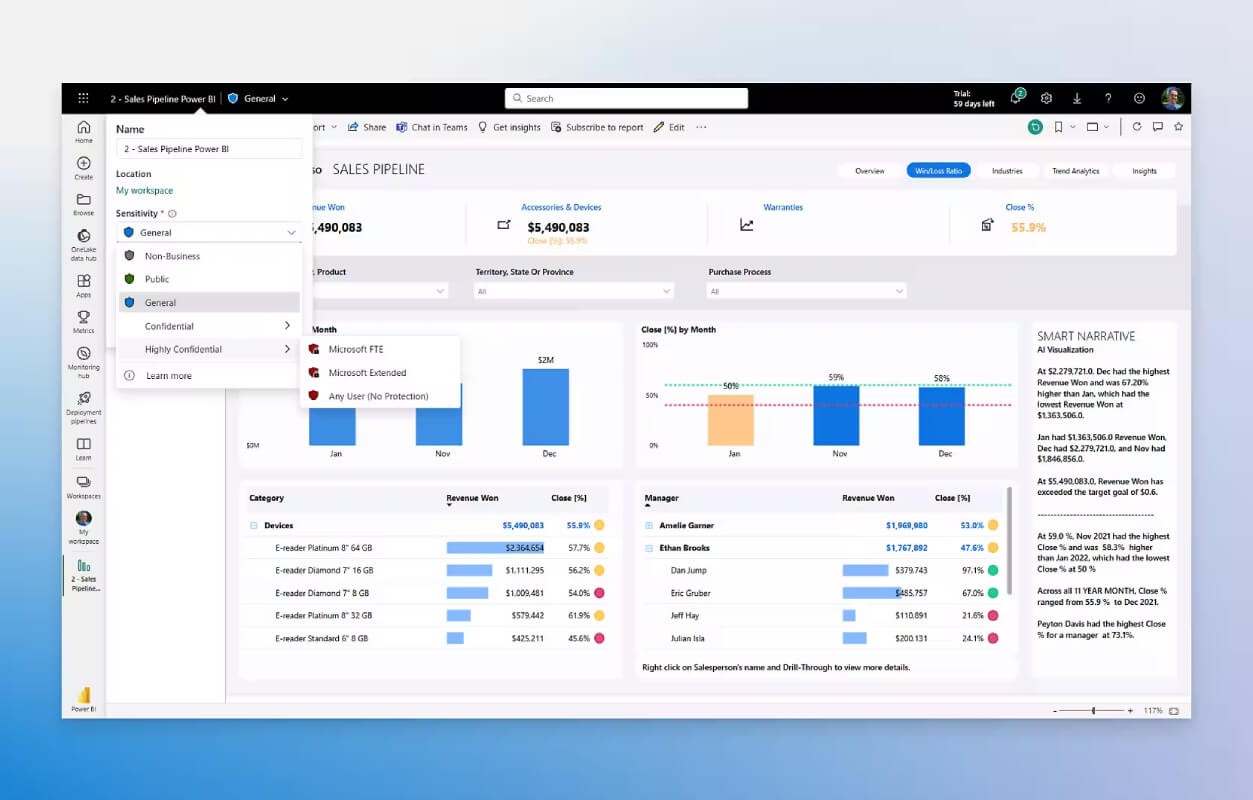
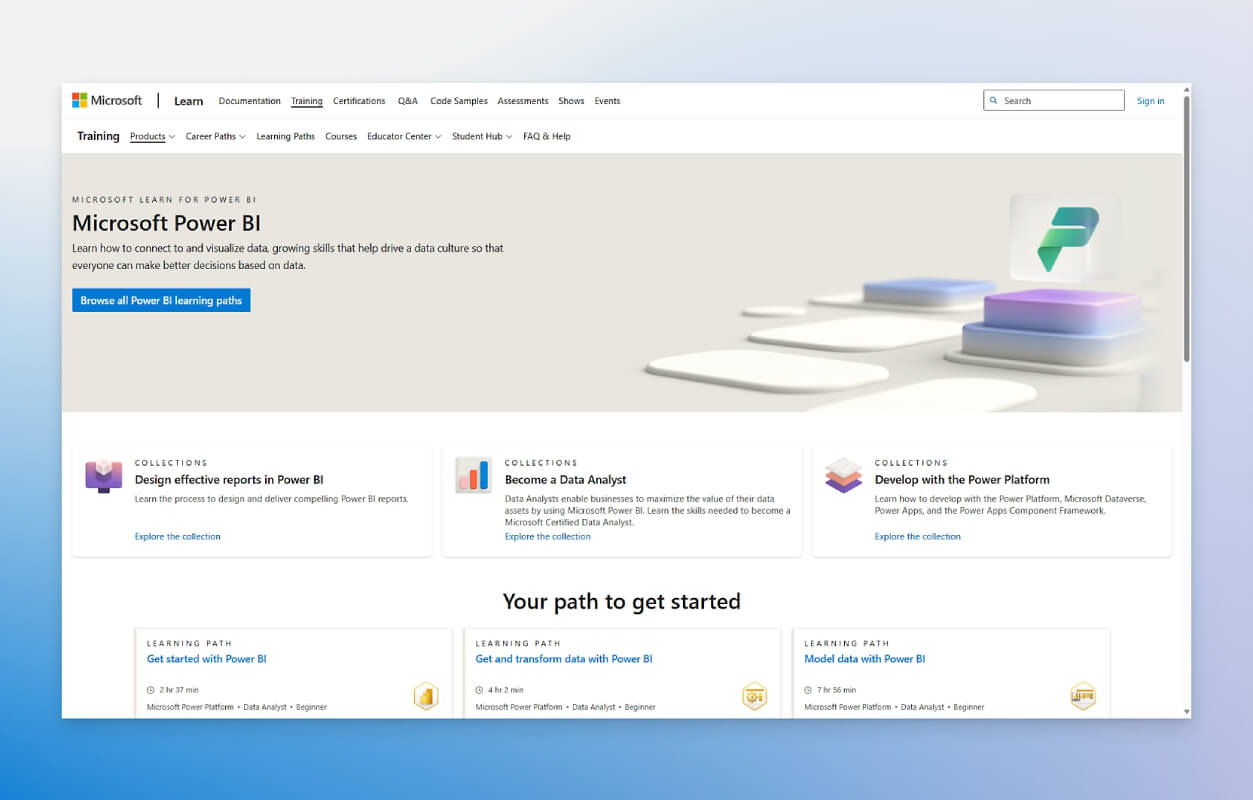
Power BI, a component of the Microsoft Power Platform, is a comprehensive business intelligence and self-service analytics solution that empowers users to visualize and analyze data from multiple sources. It provides features such as data modeling, transformation, and advanced analytics, ensuring a single source of truth. Seamlessly integrating with Microsoft 365 and other popular apps, Power BI enhances productivity and streamlines decision-making.
Power BI, a component of the Microsoft Power Platform, is a comprehensive business intelligence and self-service analytics solution that empowers users to visualize and analyze data from multiple sources. It provides features such as data modeling, transformation, and advanced analytics, ensuring a single source of truth. Seamlessly integrating with Microsoft 365 and other popular apps, Power BI enhances productivity and streamlines decision-making.
Power BI Platforms
Android
Web-Based
Windows
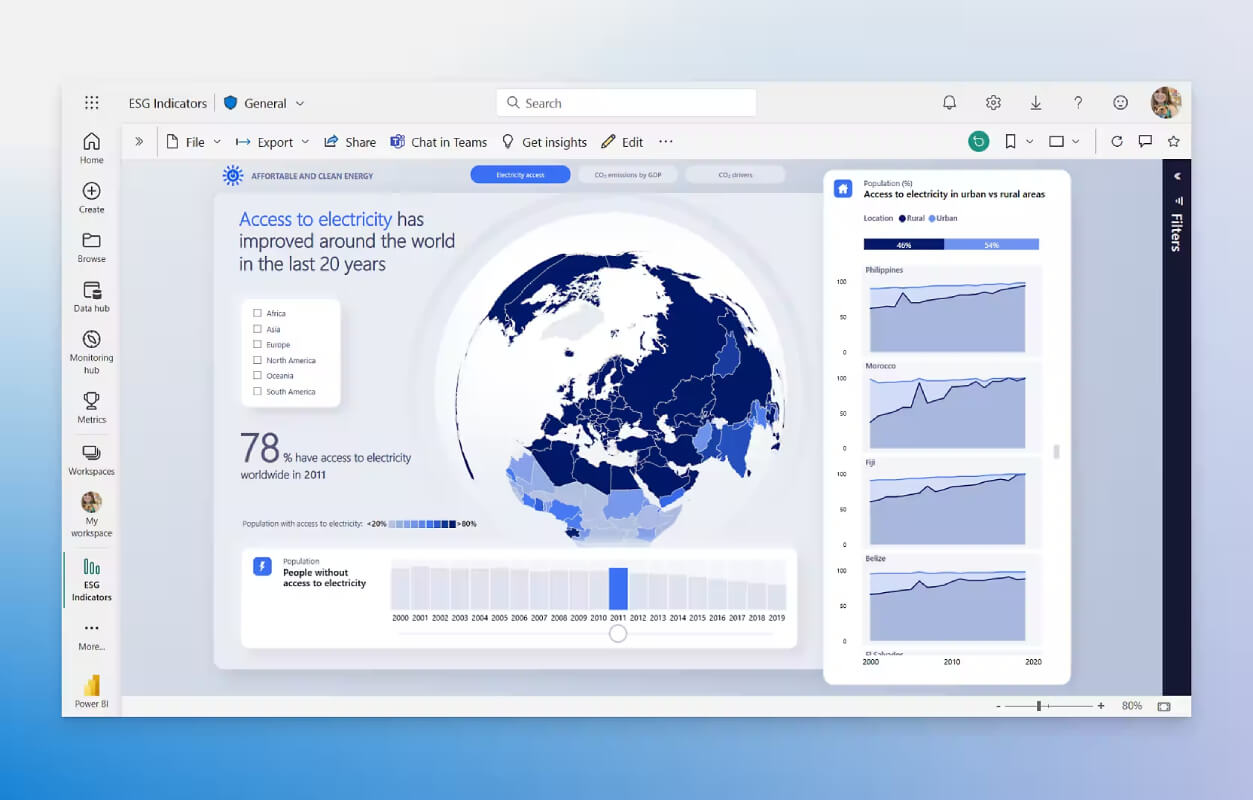
Power BI Video and Screenshots
Power BI Overview
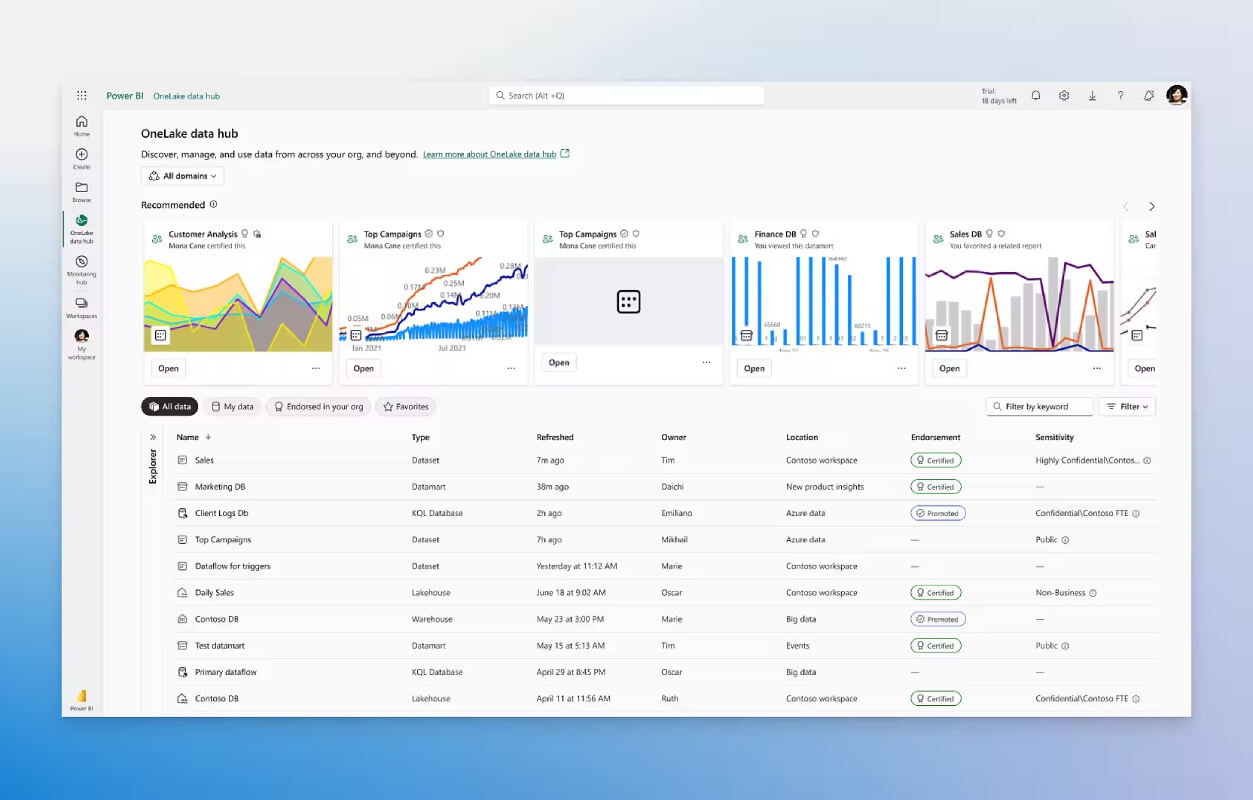
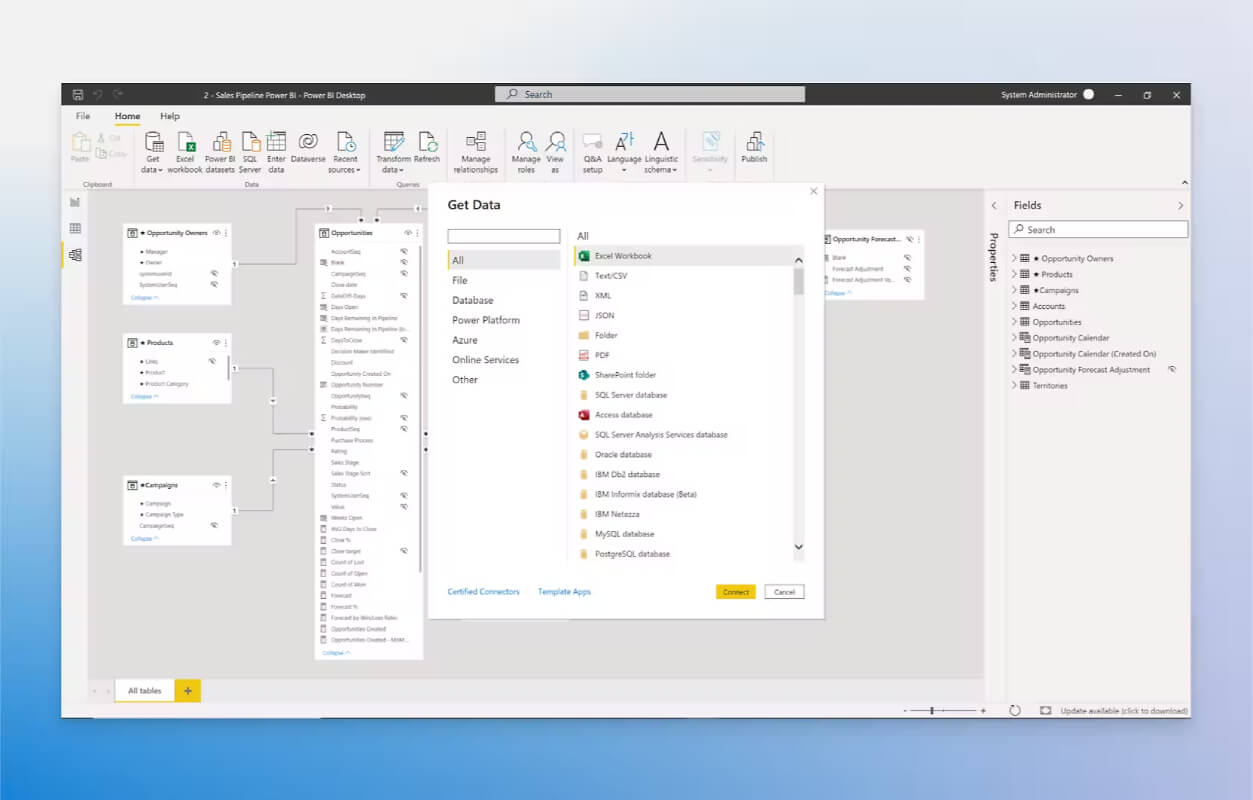
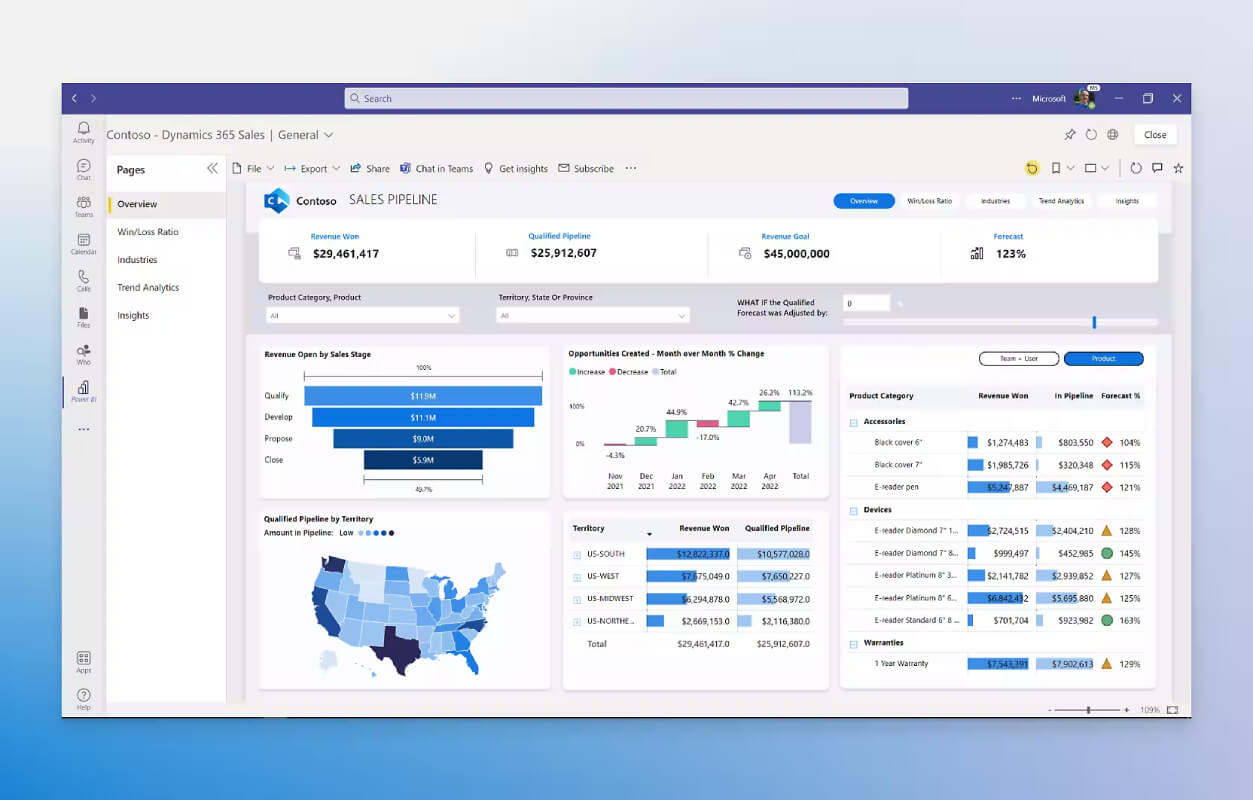
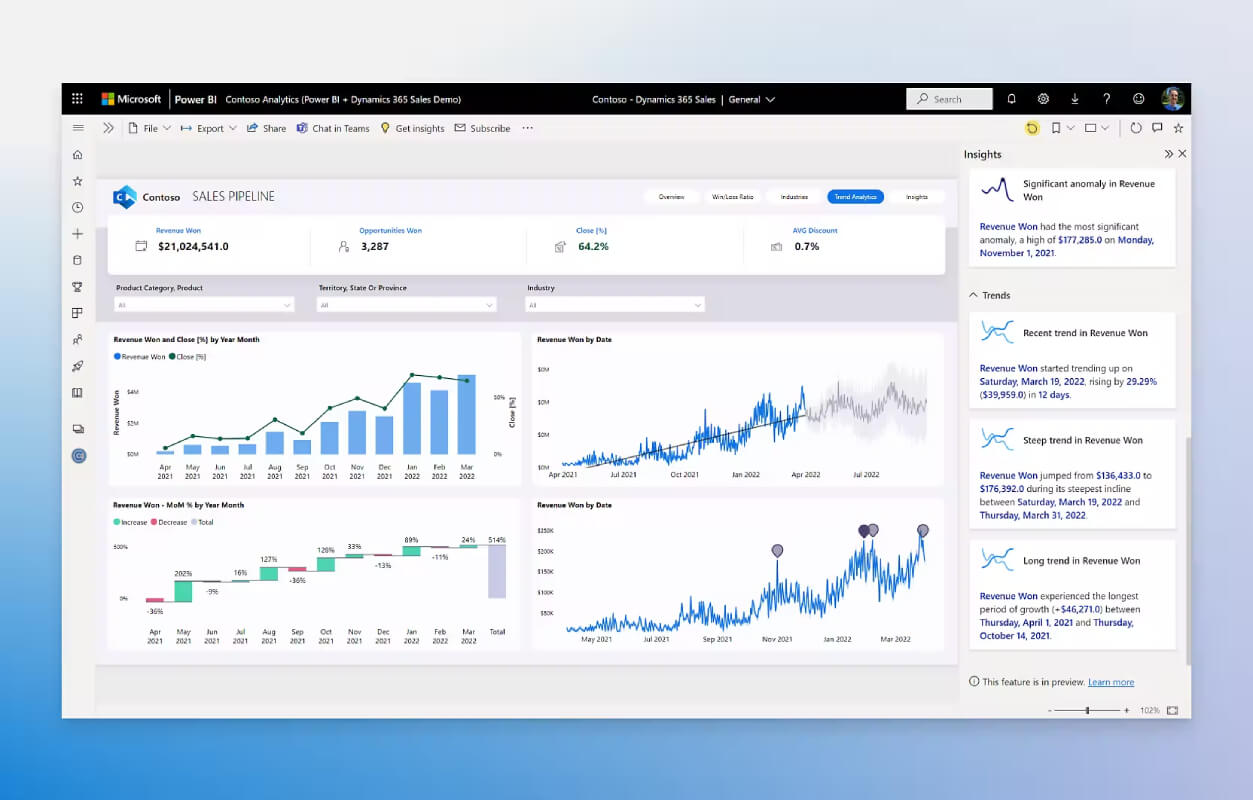
Power BI is a powerful business analytics tool developed by Microsoft, designed to help organizations transform raw data into actionable insights through interactive visualizations and business intelligence (BI) reports. With Power BI, users can connect to a variety of data sources, from Excel sheets to cloud-based databases, and create customizable dashboards that display real-time analytics. The platform provides a wide array of visualization options, such as graphs, charts, and tables, allowing users to make data-driven decisions with ease.
The tool's key features include data modeling, data transformation, and integration with various data sources, making it a versatile solution for businesses of all sizes. Power BI also supports collaboration, allowing teams to share dashboards and reports securely. Its natural language query capabilities make it accessible to non-technical users, enabling them to ask data-related questions and get answers instantly. As a scalable, cloud-based platform, Power BI offers flexibility and ease of use, making it an essential tool for businesses looking to leverage their data for improved decision-making and performance analysis.