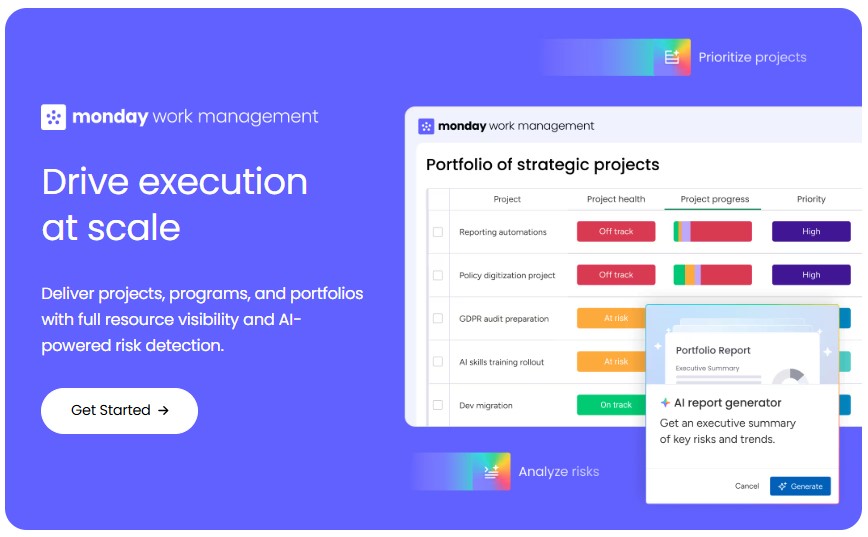
A versatile cloud-based platform, optimizes project management and team collaboration. Boosting productivity across software development, marketing, sales CRM, HR, it empowers seamless task tracking, deadline management, and analytics for enhanced p…
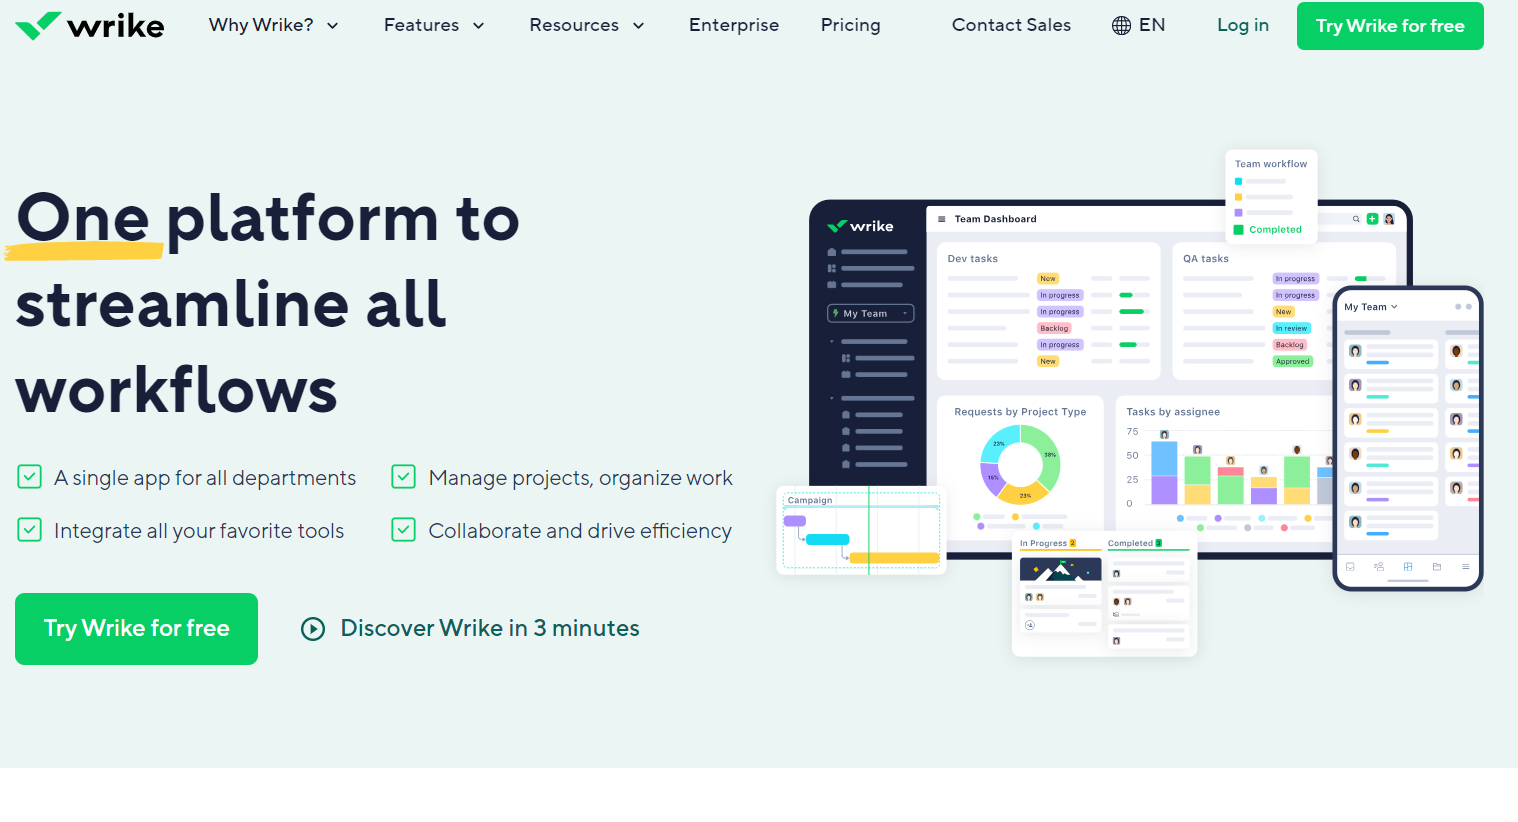
Dynamic work management platform fostering seamless collaboration in task handling, project planning, and document sharing. Perfect for businesses with multiple teams requiring efficient coordination. Track time and manage tasks effortlessly.
Power BI, a component of the Microsoft Power Platform, is a comprehensive business intelligence and self-service analytics solution that empowers users to visualize and analyze data from multiple sources. It provides features such as data modeling, …
Business intelligence platform that provides data analytics and visualization solutions. It enables to analyze complex data sets and create interactive dashboards for better insights into their business performance. It also offers a range of feature…
ThoughtSpot is an AI-powered analytics tool that allows you to ask data questions in natural language and get accurate answers. It enables you to analyze, explore, and share insights from your data, connect to various data sources, and model your da…
MATLAB is a proprietary programming language and computing environment for numeric analysis, algorithm development, data visualization, and matrix manipulation. It supports interfacing with other languages, creating user interfaces, and is widely us…
Analytics platform for measuring user behavior and analyzing events on websites and mobile applications. It allows companies to collect data on user actions such as clicks, page views, interactions with interface elements, and analyze this data to u…
Digital insights platform empowering teams to enhance customer experiences by identifying user struggles and making swift improvements for an intuitive experience.
Databricks Data Intelligence Platform powered by generative AI provides user-friendly tools for effective metadata management, visualization, and data automation. Based on Apache Spark, it provides fast and scalable real-time data analysis.
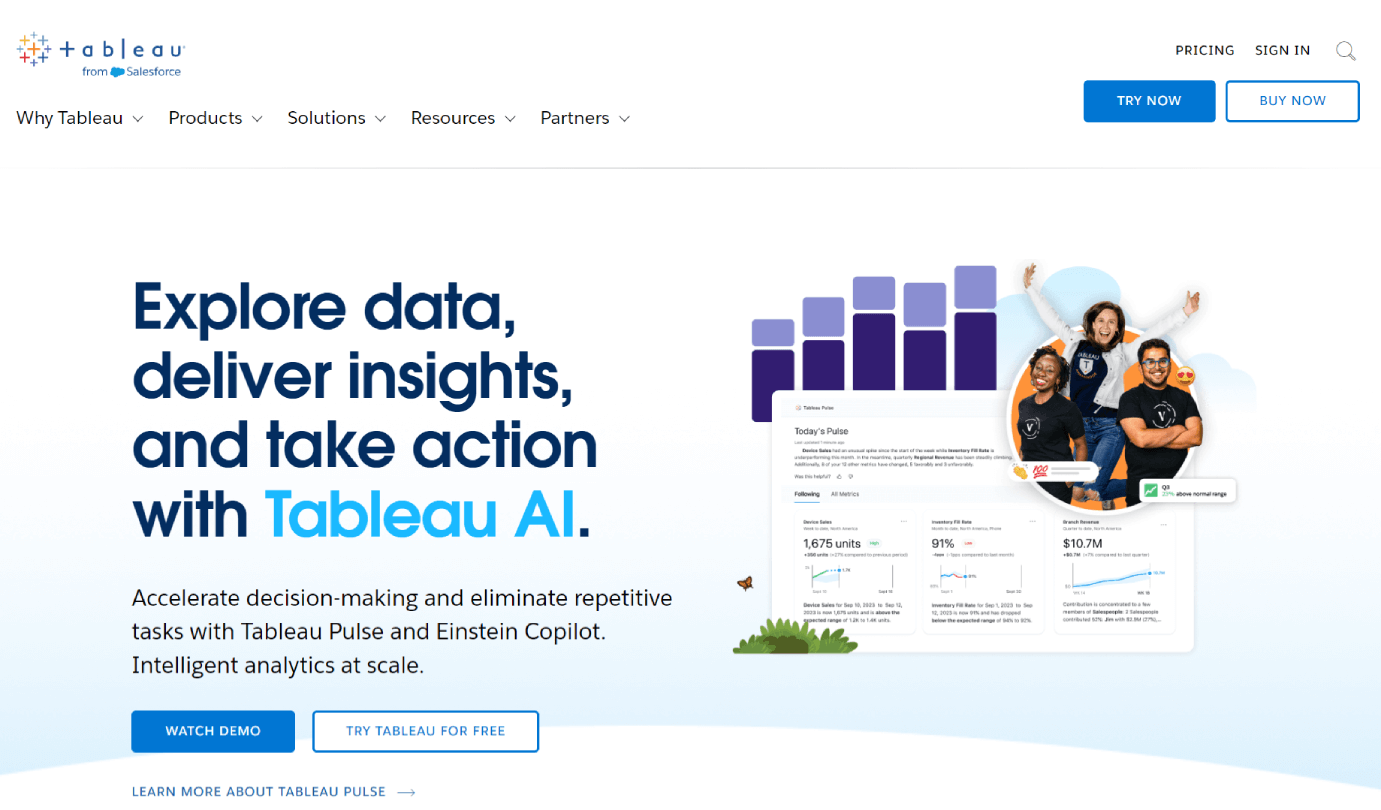
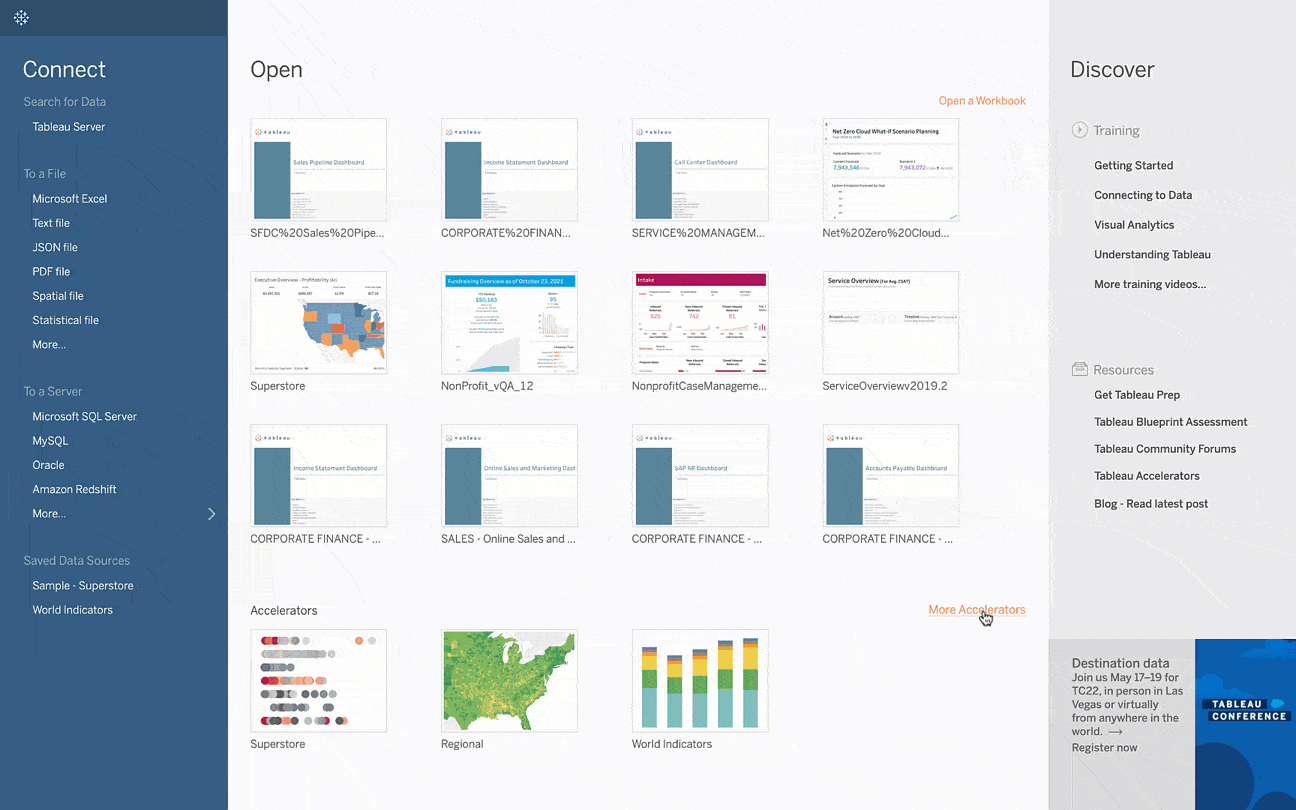
Tableau is a powerful data visualization and business intelligence tool that allows you to analyze and visualize data in an interactive and meaningful way. It enables users to connect to various data sources, create dashboards, and share insights.
Tableau is a powerful data visualization and business intelligence tool that allows you to analyze and visualize data in an interactive and meaningful way. It enables users to connect to various data sources, create dashboards, and share insights.
Tableau Platforms
Linux
Mac
Web-Based
Windows
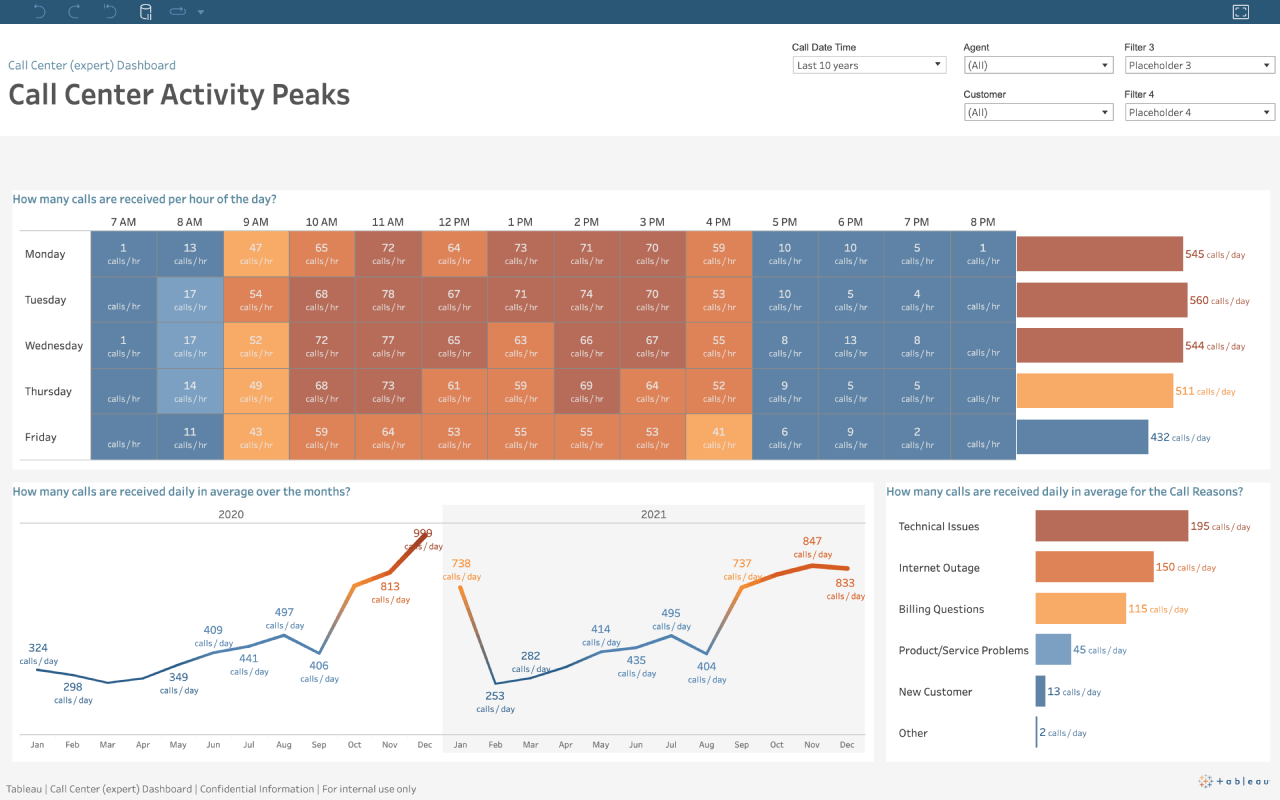
Tableau Video and Screenshots
Tableau Overview
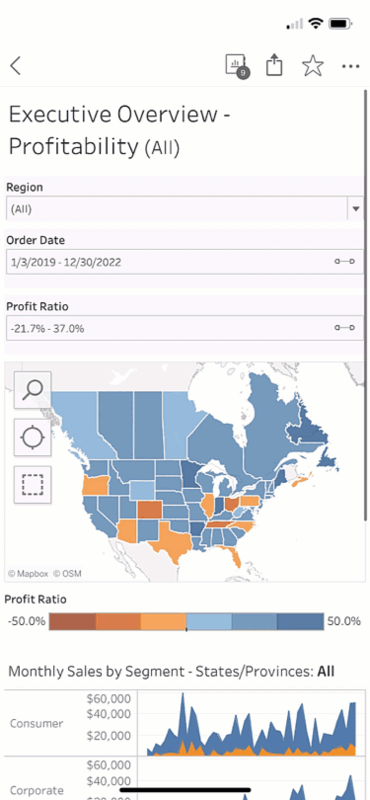
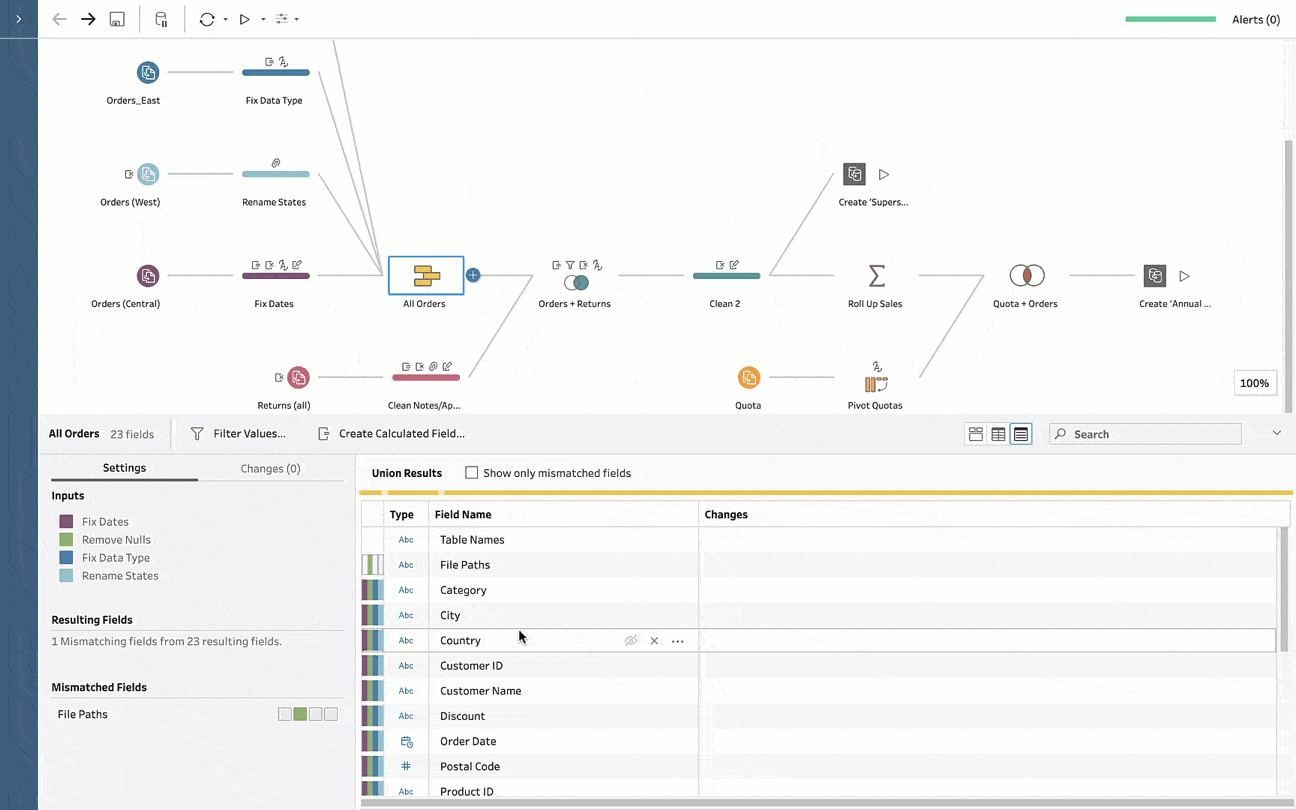
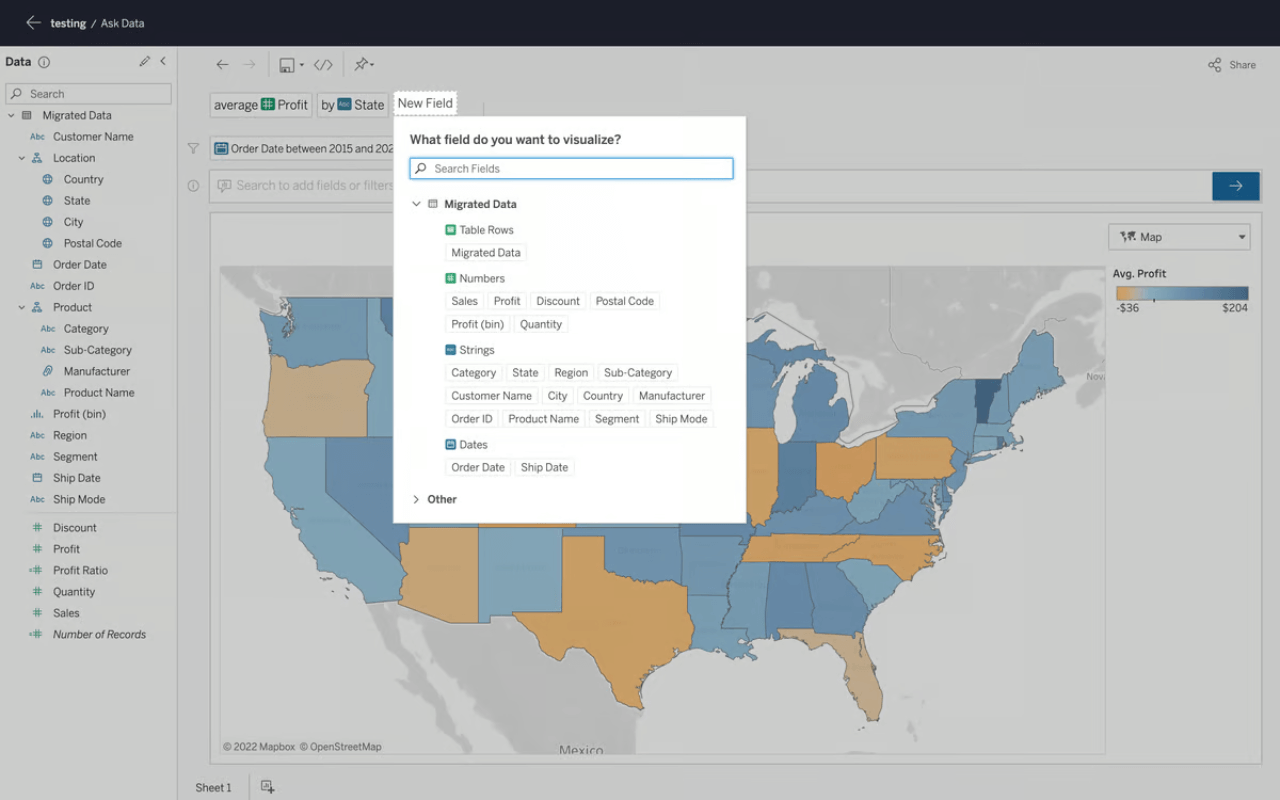
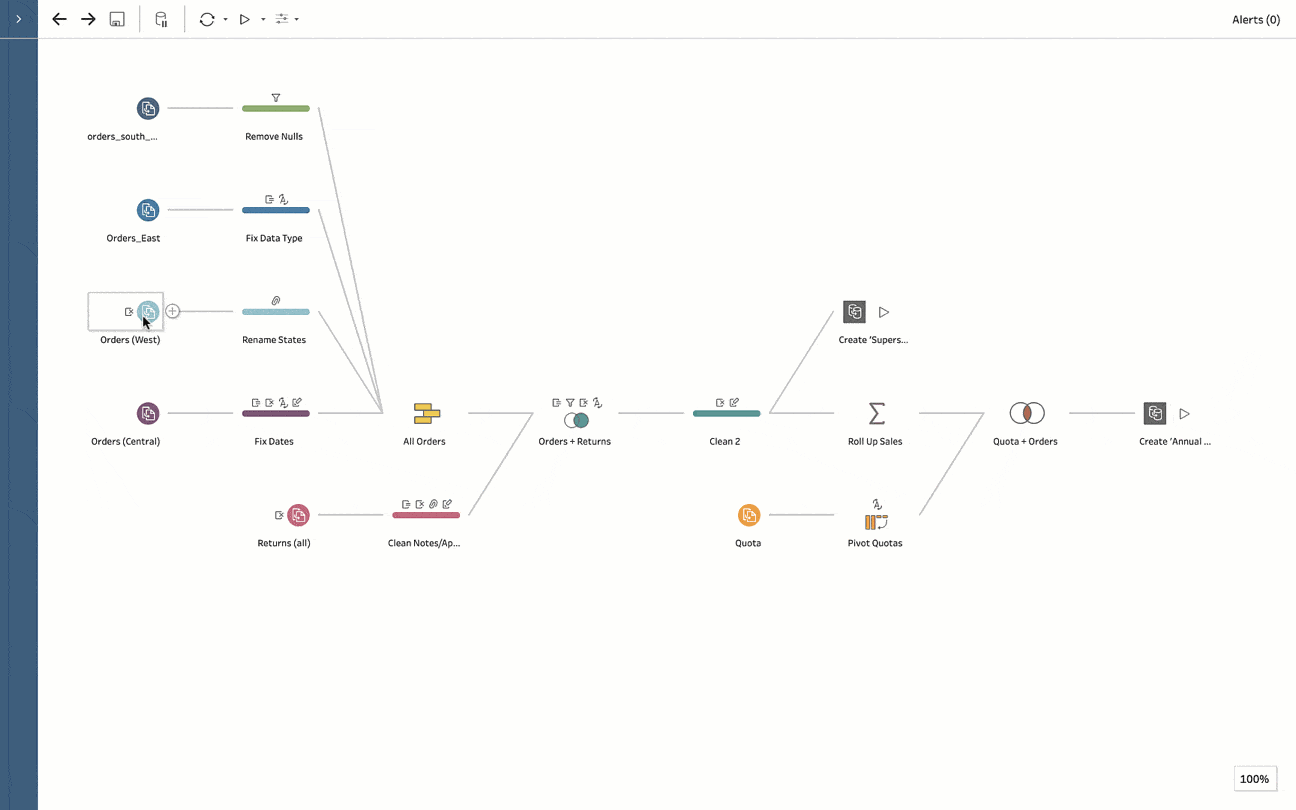
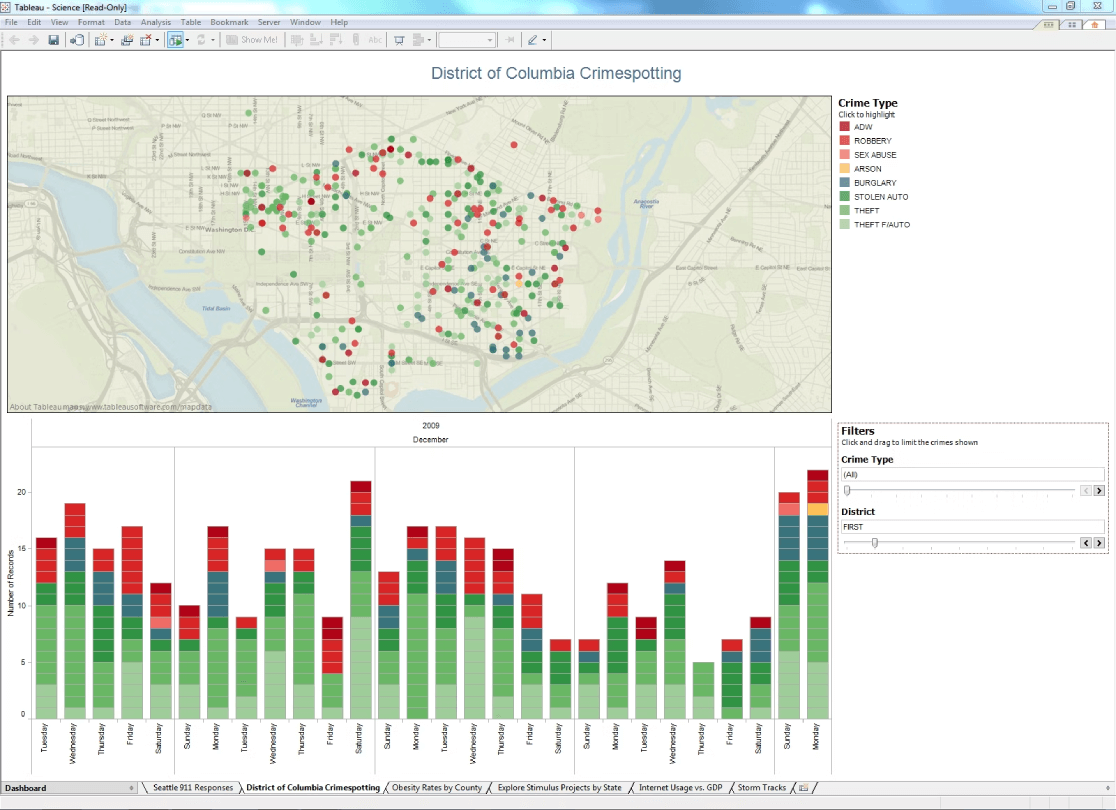
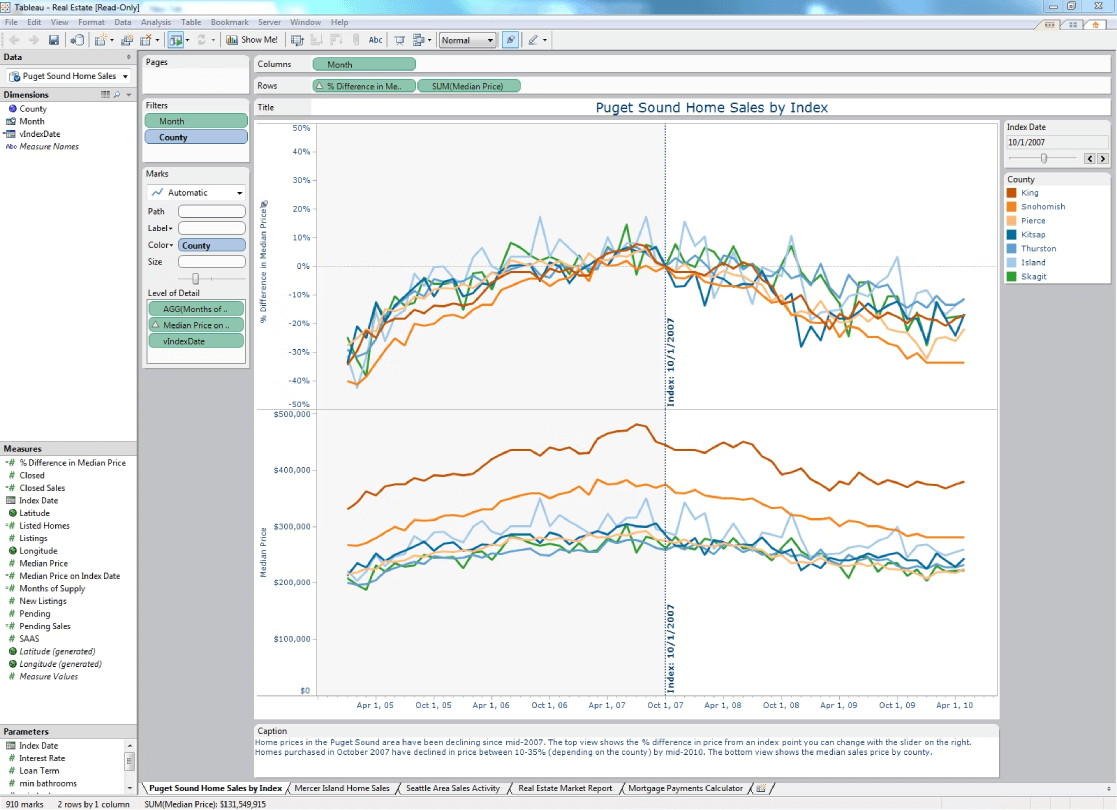
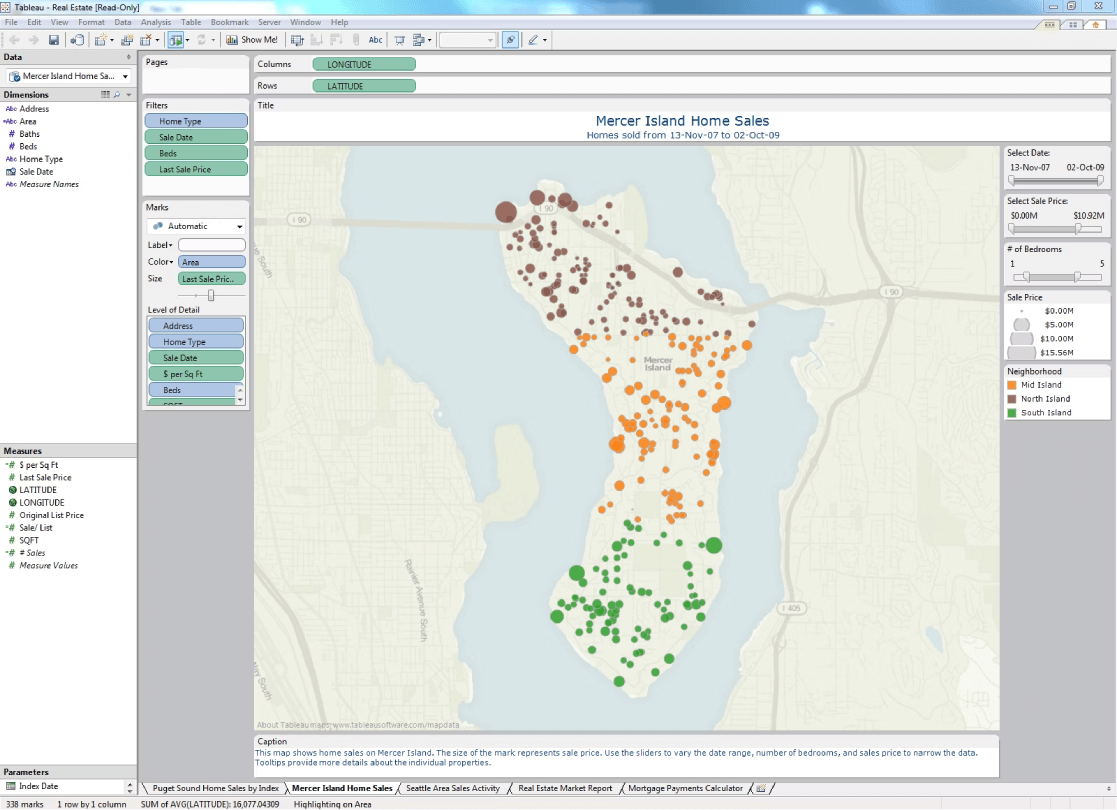
Tableau is a leading business intelligence platform that transforms raw data into interactive visualizations and insightful reports. It connects seamlessly with multiple data sources, including databases, cloud services, and spreadsheets, allowing users to create dynamic dashboards with real-time updates. Its intuitive drag-and-drop interface simplifies data analysis, making it accessible to both technical and non-technical users. With advanced analytics, AI-driven insights, and built-in statistical functions, Tableau enables businesses to uncover trends, identify patterns, and make data-driven decisions faster.
The platform supports collaboration by enabling teams to share reports, set up automated alerts, and embed analytics into applications. Tableau's scalability ensures it meets the needs of small businesses and large enterprises alike, with cloud, on-premises, and hybrid deployment options. Strong security controls protect sensitive information, while integrations with machine learning tools enhance predictive analytics. By providing deep data insights and powerful visualization capabilities, Tableau empowers organizations to optimize operations, improve strategic planning, and drive business growth.