Minitab, a robust statistical package, empowers users with diverse analyses: from descriptive stats, hypothesis tests, and regression analysis to ANOVA. Ideal for quality control, it enhances process quality through effective statistical methods.
Stata is a software product for statistical data analysis. It is widely used in research, social sciences, economics, and other fields. Stata allows you performin a variety of statistical analyses, including regression models, hypothesis testing, ti…
Tableau is a powerful data visualization and business intelligence tool that allows you to analyze and visualize data in an interactive and meaningful way. It enables users to connect to various data sources, create dashboards, and share insights.
IBM SPSS Statistics is a statistical data analysis software developed by IBM. It is used to process and analyze statistical data in various fields such as research, business, science, and social sciences.
It has a wide range of functions aimed at processing, visualizing, and analyzing scientific and engineering data. It also supports graphing, statistical analysis, signal processing, function approximation, spectrum work, and much more.
ATLAS.ti is a qualitative data analysis platform designed to extract insights from diverse data types, including text, images, and audio. It offers comprehensive data management, analysis, and collaboration capabilities across Windows, Mac, and web …
Amazon Kinesis is a fully managed data stream processing service on AWS that collects, buffers, and processes real-time data, enabling insights in minutes. It supports real-time analytics, IoT data analysis, and video analytics applications, handlin…
ZoomInfo OperationsOS is a data management platform for sales and marketing departments. Its function is to cleanse, enrich, route, and synchronize customer and lead data, making it more useful for decision-making and operations.
Condens is a centralized hub for storing, analyzing, sharing, and scaling customer insights, boosting speed and efficiency. It offers AI-driven analysis, multilingual transcription, and real-time collaboration, creating a single source of truth for …
An Excel add-on for advanced statistical analysis, offering tools for data visualization, regression, PLS models, demand forecasting, and more.
An Excel add-on for advanced statistical analysis, offering tools for data visualization, regression, PLS models, demand forecasting, and more.
XLSTAT Platforms
Mac
Web-Based
Windows
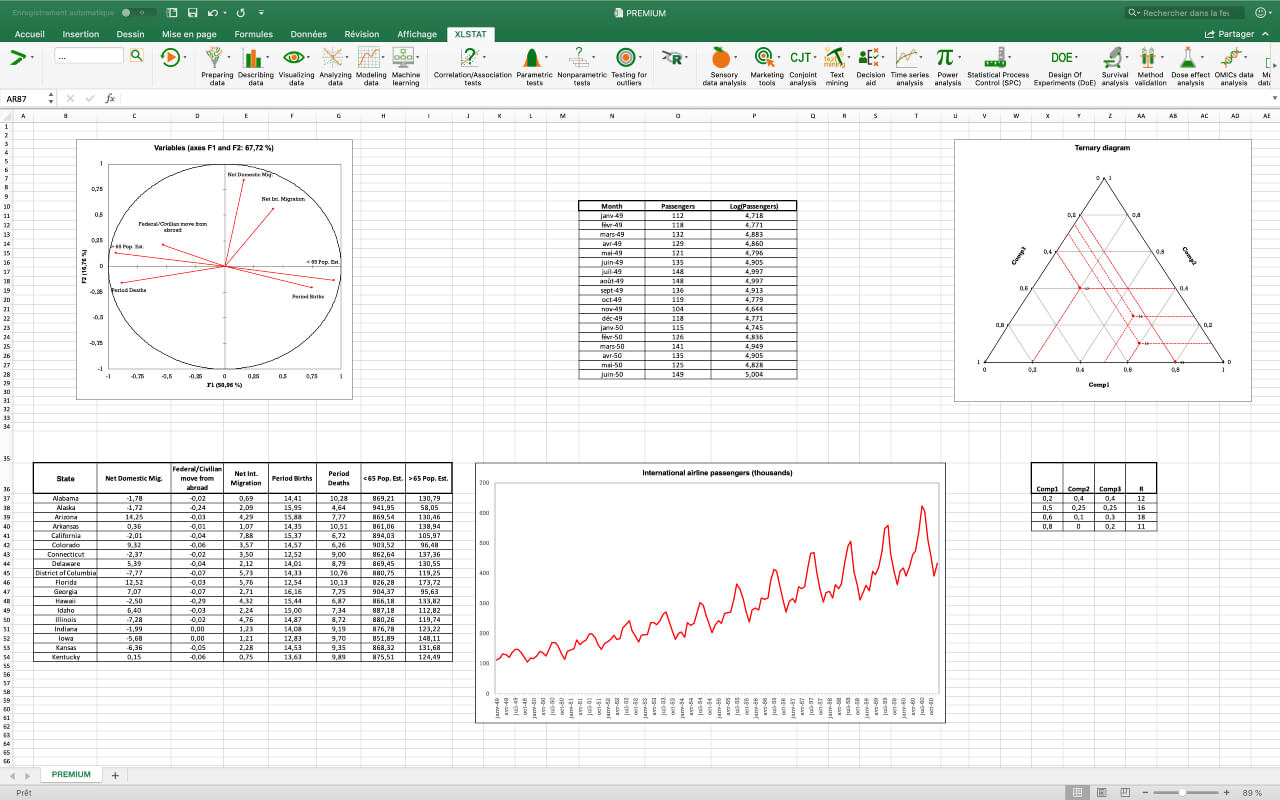
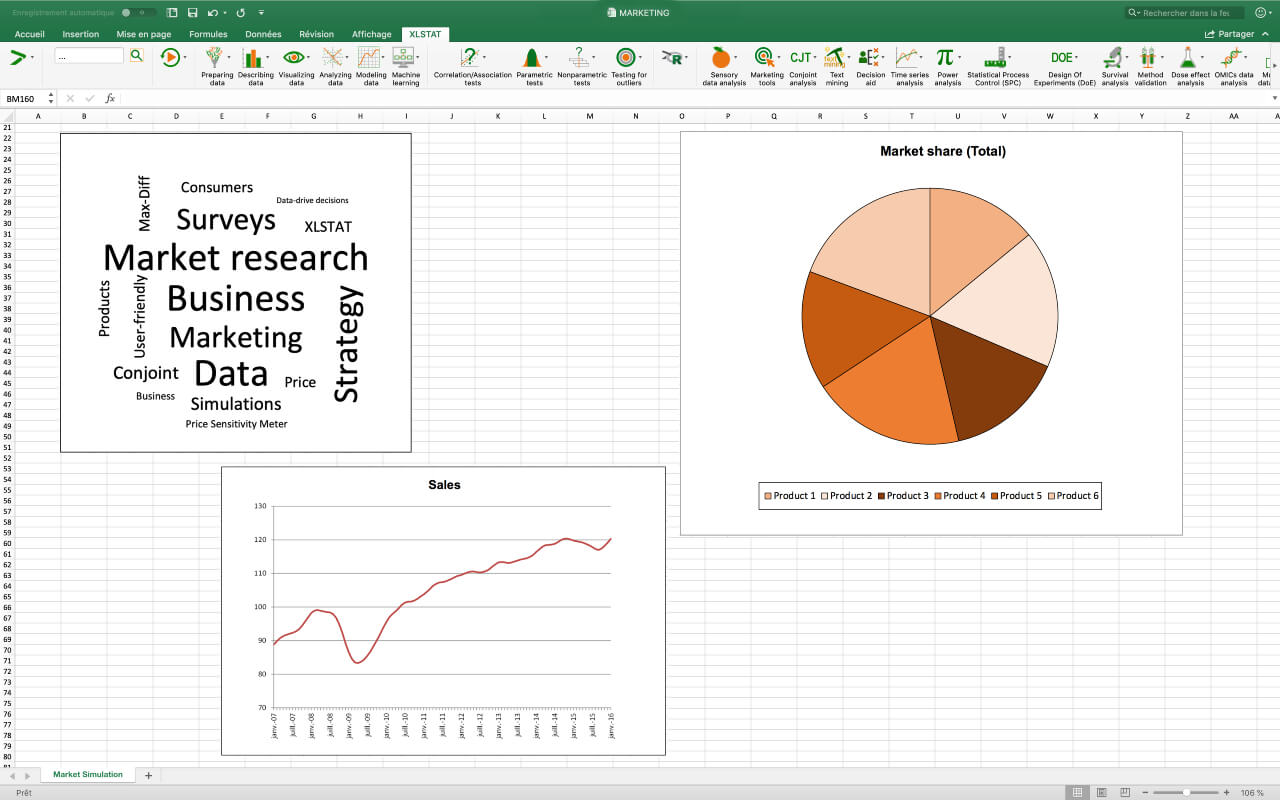
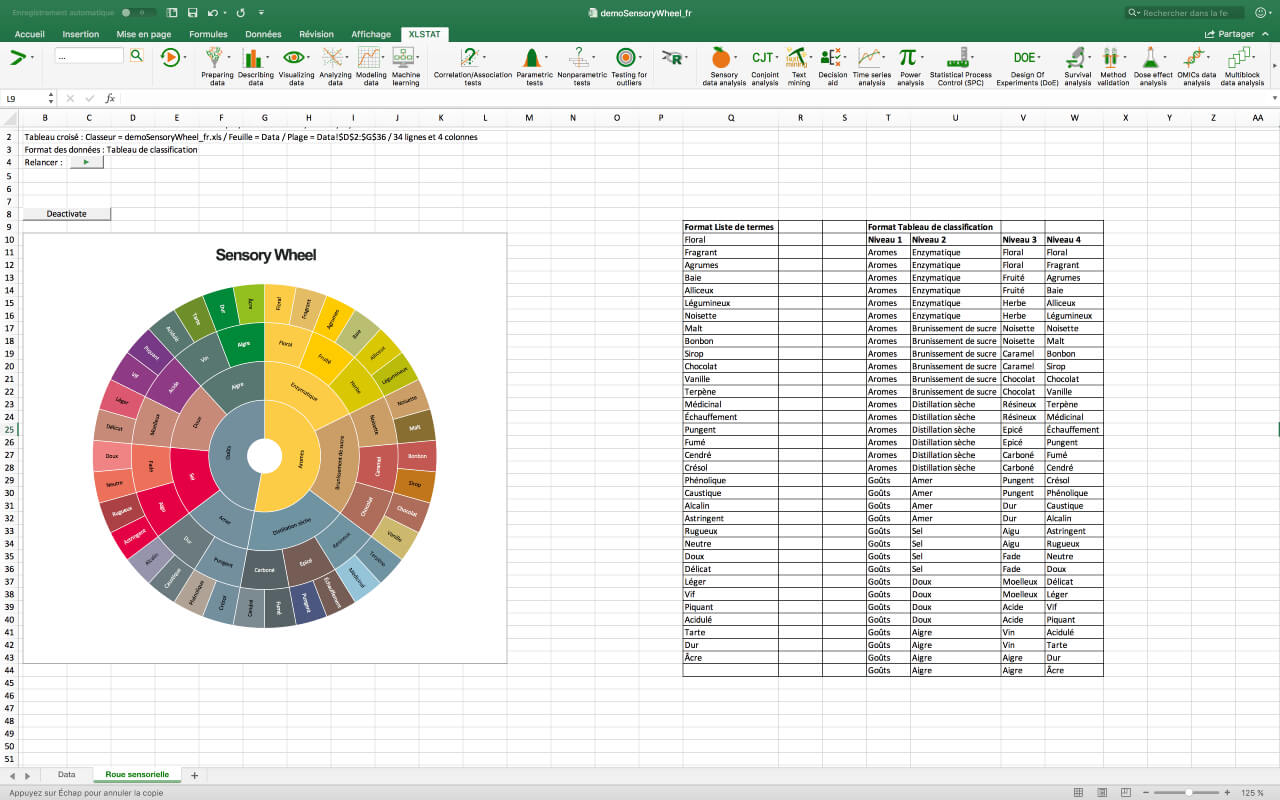
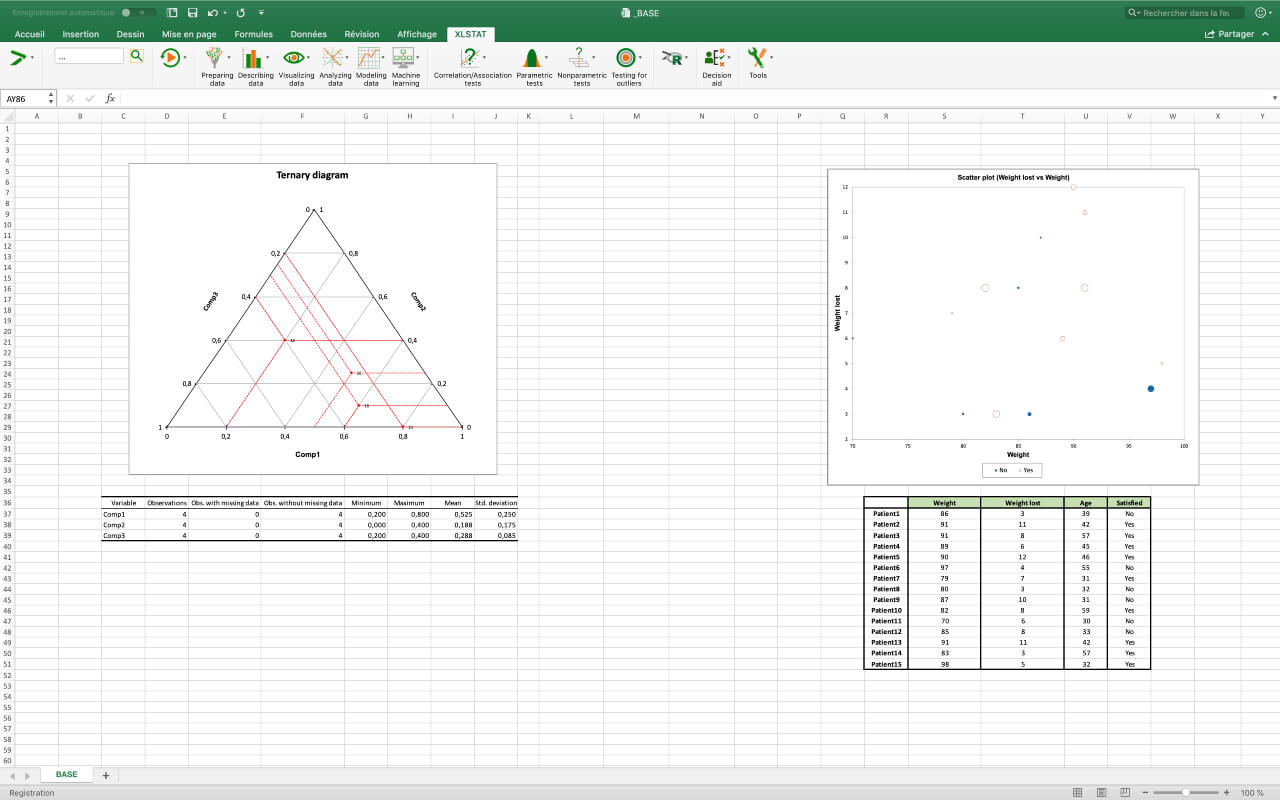
XLSTAT Video and Screenshots
XLSTAT Overview
XLSTAT is a comprehensive statistical analysis add-on for Microsoft Excel, offering over 200 functions designed to enhance data analysis capabilities. It provides powerful tools for a wide range of analyses, from basic descriptive statistics to complex multivariate analysis and machine learning. The integration with Excel makes it easy for users to transition seamlessly between data analysis and visualization, leveraging the familiar Excel environment. XLSTAT is widely used by professionals across various fields, including marketing, life sciences, and sensory analysis, offering tailored solutions for specific needs.
In addition to its extensive feature set, XLSTAT provides both free and paid versions, catering to different levels of analytical requirements. The free version includes essential tools suitable for students and professionals who need basic statistical functions, while the premium versions, like XLSTAT Basic+, Sensory, and Life Sciences, offer advanced features for more in-depth analysis. Trusted by over 150,000 users globally, XLSTAT is a reliable and flexible tool that adapts to the evolving needs of data analysts, researchers, and educators.