We've compiled a list of 24 free and paid alternatives to Statwing. The primary competitors include MATLAB, Matomo. In addition to these, users also draw comparisons between Statwing and Scilab, Datadog, JMP. Also you can look at other similar options here: About.
We've compiled a list of 24 free and paid alternatives to Statwing. The primary competitors include MATLAB, Matomo. In addition to these, users also draw comparisons between Statwing and Scilab, Datadog, JMP. Also you can look at other similar options here: About.
IBM SPSS Statistics is a statistical data analysis software developed by IBM. It is used to process and analyze statistical data in various fields such as research, business, science, and social sciences.
Minitab, a robust statistical package, empowers users with diverse analyses: from descriptive stats, hypothesis tests, and regression analysis to ANOVA. Ideal for quality control, it enhances process quality through effective statistical methods.
Tableau is a powerful data visualization and business intelligence tool that allows you to analyze and visualize data in an interactive and meaningful way. It enables users to connect to various data sources, create dashboards, and share insights.
It has a wide range of functions aimed at processing, visualizing, and analyzing scientific and engineering data. It also supports graphing, statistical analysis, signal processing, function approximation, spectrum work, and much more.
EViews, a software for statistical analysis and econometric modeling, is widely employed in financial research, economic analysis, and forecasting. Tailored for economic and financial data, it features a user-friendly interface and utilizes diverse …
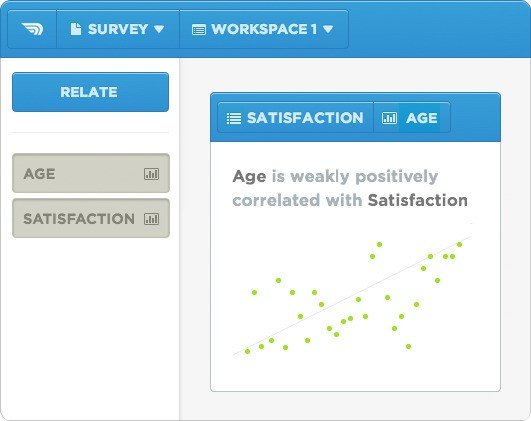
Statwing was built by and for analysts, so you can clean data, explore relationships, and create...
Statwing was built by and for analysts, so you can clean data, explore relationships, and create...
Statwing Platforms
Web-Based
Statwing Video and Screenshots
Statwing Overview
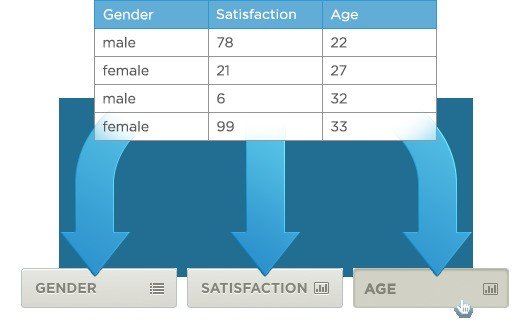
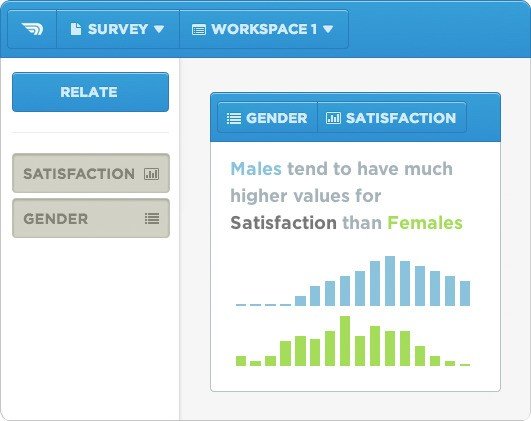
Statwing was built by and for analysts, so you can clean data, explore relationships, and create charts in minutes instead of hours. Simply upload your spreadsheet or dataset, then select the relationships you want to explore.