We've compiled a list of 15 free and paid alternatives to picasso.js. The primary competitors include D3.js, Plotly. In addition to these, users also draw comparisons between picasso.js and CanvasJS Charts, Highcharts, Chart.js. Also you can look at other similar options here: About.
We've compiled a list of 15 free and paid alternatives to picasso.js. The primary competitors include D3.js, Plotly. In addition to these, users also draw comparisons between picasso.js and CanvasJS Charts, Highcharts, Chart.js. Also you can look at other similar options here: About.
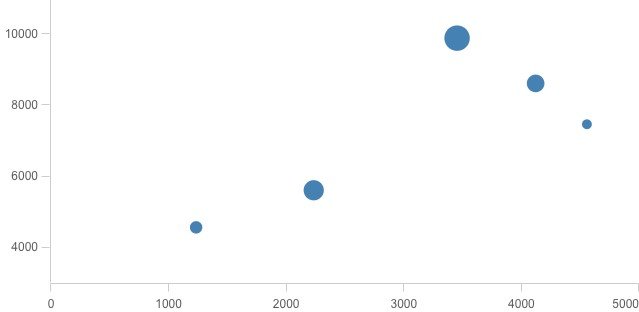
Turn boring data into a visual masterpiece using picasso.js, an open-source library from Qlik.
Turn boring data into a visual masterpiece using picasso.js, an open-source library from Qlik.
picasso.js Platforms
Web-Based
picasso.js Video and Screenshots
picasso.js Overview
Turn your data into a visual masterpiece
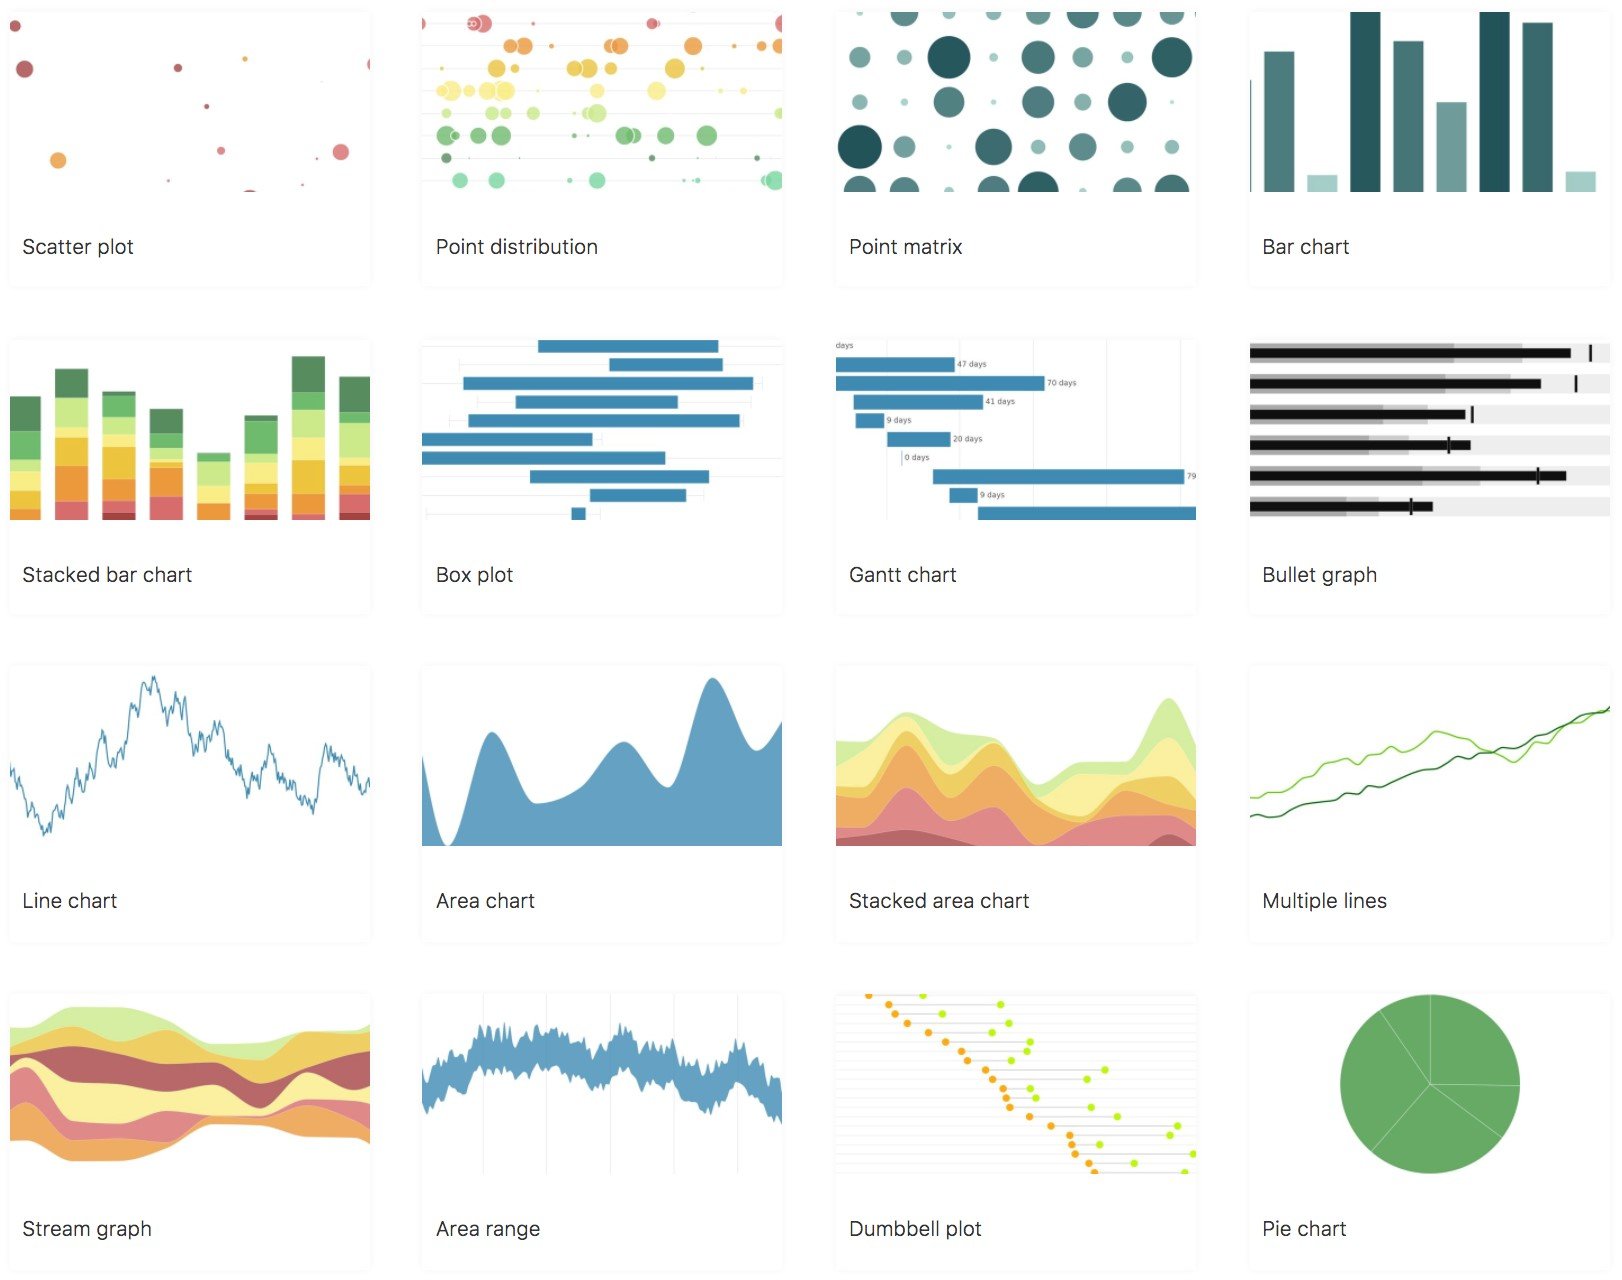
Components in picasso.js Components are the visual building blocks that make up the chart, by combining them in various forms virtually any chart can be created. A bar chart, for example, consists of a bar layer, a continuous and a discrete axis. Add a line layer and you have a combo chart. Want a line chart with four axes? - Not a problem.
picasso.js is extensible picasso.js provides a plugin system that makes it easy to extend existing functionality - you can register and use custom components that play well with the existing ones, create a new theme, provide your own data parser or even register a custom renderer that outputs sketchy graphics. picasso.js uses D3.js for a lot of its functionality and strives to provide the D3 community with a way to repurpose and easily integrate their work into picasso.js.
Interactive Apart from basic interaction patterns, interactivity in the form of brushing and linking is provided out of the box - drag a range on a linear axis to highlight all values that fall within that range, our use the lasso tool to highlight a cluster of points. The brushed values can then programmatically be linked and highlighted in another chart instance.
Responsive By using relative units and a unique layout algorithm we can ensure the composed charts are responsive. The same configuration can be used for a full sized chart containing details, annotations etc., as for a sparkline version - components are automatically resized or removed if they don't fit.
Themeable The visual look of labels, lines, shapes, color palettes etc. can all be modified and a new theme created by just changing a few base variables that control the look and feel throughout, including plugins.