We've compiled a list of 55 free and paid alternatives to AnyChart. The primary competitors include draw.io, Lucidchart. In addition to these, users also draw comparisons between AnyChart and Asana, Matomo, MongoDB. Also you can look at other similar options here: Development Tools.
We've compiled a list of 55 free and paid alternatives to AnyChart. The primary competitors include draw.io, Lucidchart. In addition to these, users also draw comparisons between AnyChart and Asana, Matomo, MongoDB. Also you can look at other similar options here: Development Tools.
Asana is a comprehensive project management software that enables teams to efficiently manage tasks and projects. Its features include task creation and assignment, priority setting, progress tracking, and file attachment.
Streamlines online diagramming with its extensive template library and user-friendly interface. For complex processes, organizational structures, mind maps, and flowcharts, fostering collaboration and productivity.
SquaredUp is a data visualization platform that integrates with multiple data sources, including code repositories and customer interaction systems, through plugins or a Web API. It enables teams to explore, analyze, and visualize data, providing in…
ATLAS.ti is a qualitative data analysis platform designed to extract insights from diverse data types, including text, images, and audio. It offers comprehensive data management, analysis, and collaboration capabilities across Windows, Mac, and web …
Amazon Kinesis is a fully managed data stream processing service on AWS that collects, buffers, and processes real-time data, enabling insights in minutes. It supports real-time analytics, IoT data analysis, and video analytics applications, handlin…
TimeXtender is a metadata-driven, low-code data integration platform that automates data ingestion, preparation, and delivery across storage platforms. It streamlines workflows, reduces the need for manual coding, and supports secure, scalable data …
Flexible, cross-platform and cross-browser JavaScript (HTML5) charting library that allows you to...
Flexible, cross-platform and cross-browser JavaScript (HTML5) charting library that allows you to...
AnyChart Platforms
iPhone
Linux
Mac
iPad
Android
Web-Based
Windows
AnyChart Video and Screenshots
AnyChart Overview
AnyChart is a flexible, cross-platform and cross-browser JavaScript charting library that allows you to create interactive HTML5 charts, stock charts, maps, Gantt charts, and dashboards for any project, in any browser, on any platform/OS.
AnyChart provides advanced customization and flexibility opportunities, no matter if you are developing a website, a BI app for corporate use, or software for your clients. The library's JavaScript API allows you to create even big data based charts in real time, with continuous updates, multi-level drill-downs. You can use any server platform or database, and you will get amazing informative visualization on all devices - Macs, laptops, PCs, smartphones, and tablets.
AnyChart has four main JavaScript/HTML5 charting solutions.
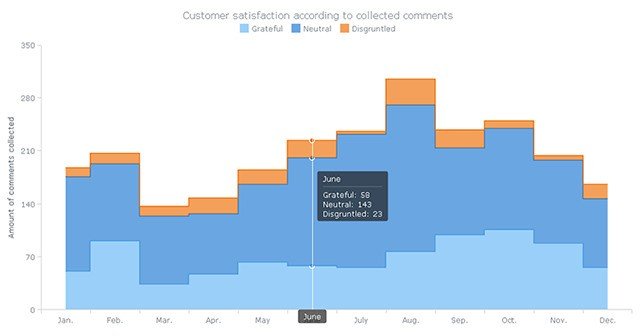
AnyChart JS Charts and Dashboards provides scatter, line, bar, area, waterfall, spline, funnel, bubble, polar, column, columnrange, pie, box plot, angular gauge, areasplinerange, and many other types of charts available separately and in combination, with single or multiple axes.
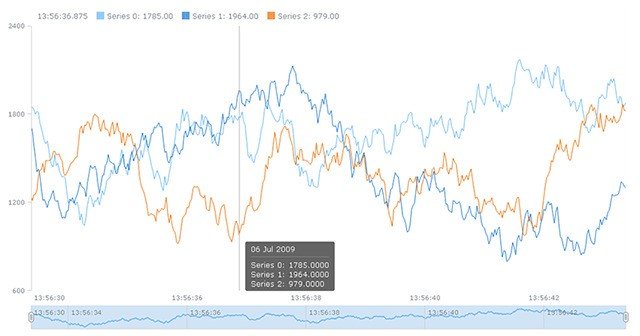
AnyStock Financial and Stock JS Charts converts any real-time data into sophisticated charts that can easily be made interactive. Scrolling, drill downs, zoom & panning make Reports and Dashboards greatly visualized to facilitate reviewing long-term and big data sets while analyzing Forex, commodity, investment, other market data.
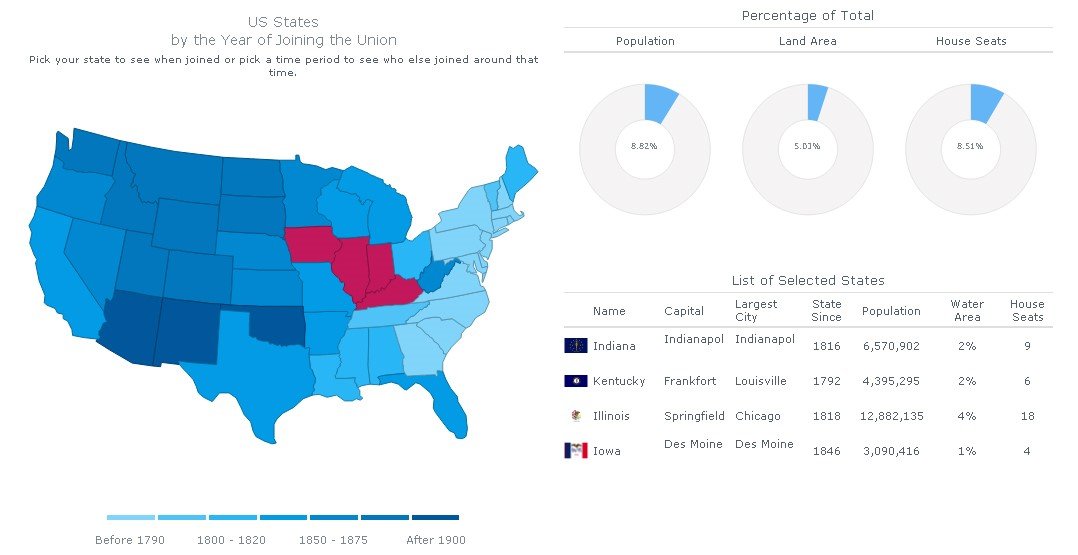
AnyMap JS Maps is perfect for dashboards and side-by-side reporting. This HTML5 mapping solution helps you build interactive maps for any browser on any platform. Use it to display sales by region, election results, population density, other geo-related data.
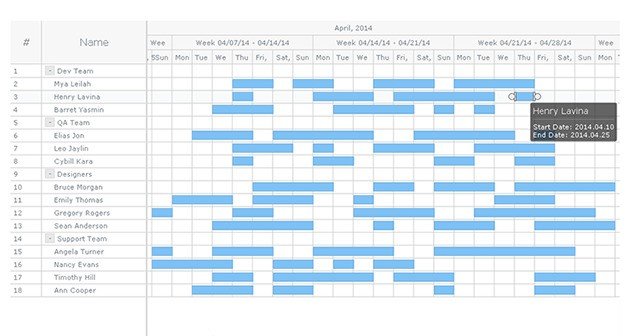
AnyGantt JS Project Charts allows you to utilize power of animation and ultimate interactivity to build complex and informative HTML5 Gantt, Resource and PERT charts, which can be used with ASP.NET, PHP, JSP, ColdFusion, Ruby on Rails or simple HTML pages to visualize data from any warehouse: text, Excel, CSV - MySQL, MS SQL, Oracle DB servers.