Dynamic work management platform fostering seamless collaboration in task handling, project planning, and document sharing. Perfect for businesses with multiple teams requiring efficient coordination. Track time and manage tasks effortlessly.
Tableau is a powerful data visualization and business intelligence tool that allows you to analyze and visualize data in an interactive and meaningful way. It enables users to connect to various data sources, create dashboards, and share insights.
Power BI, a component of the Microsoft Power Platform, is a comprehensive business intelligence and self-service analytics solution that empowers users to visualize and analyze data from multiple sources. It provides features such as data modeling, …
Business intelligence platform that provides data analytics and visualization solutions. It enables to analyze complex data sets and create interactive dashboards for better insights into their business performance. It also offers a range of feature…
A BI and analytics platform, available on the cloud and on-premise, enabling businesses to transform data into insights. With drag-and-drop tools, users create and share reports, dashboards, and KPIs.
IBM Cognos Analytics is a comprehensive BI solution that maximizes data potential. It offers advanced reporting, dynamic dashboards, and AI-infused insights for data exploration and predictive forecasting. The platform features robust governance, na…
Oracle Analytics is a cloud-native platform that offers end-to-end analytics capabilities, including data ingestion, modeling, preparation, visualization, and collaboration. Supporting on-premises, cloud, or hybrid deployment to ensure flexible and …
PopSQL is a collaborative SQL workspace designed for team data analysis, enabling real-time syncing and version control for queries and visualizations. It supports in-app charts and dashboards and integrates with Slack for seamless communication, of…
Looker Studio is designed to help you maximize the value of your data by enabling the creation of interactive dashboards and engaging reports. It allows you to seamlessly connect to various data sources using built-in and partner connectors, easily …
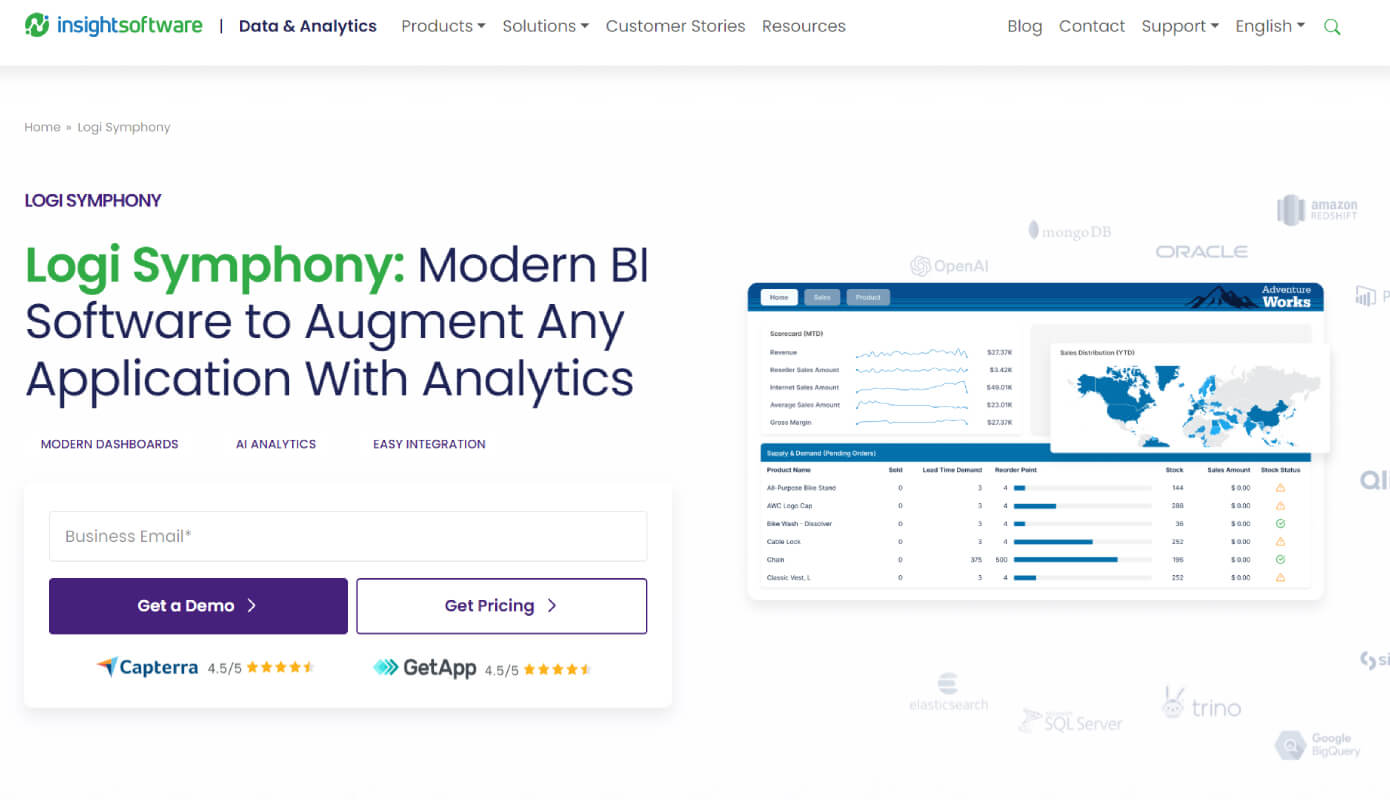
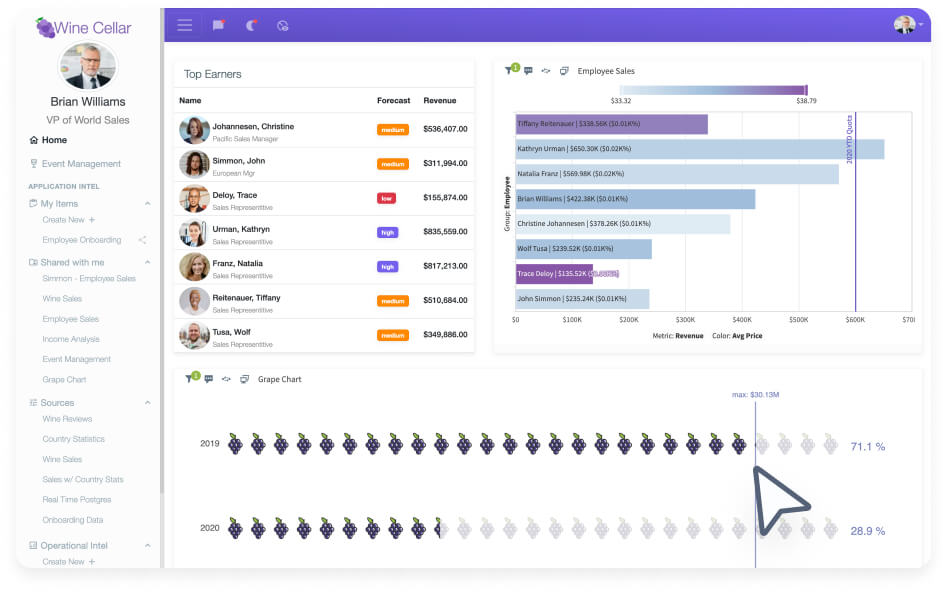
Logi Symphony is BI software that integrates advanced analytics into applications, providing operational reporting, interactive visualizations, and AI-driven insights. It supports diverse data sources, offers no/low-code integration, ensures real-time governed analytics, and simplifies deployment and maintenance to streamline development and decision-making.
Logi Symphony is BI software that integrates advanced analytics into applications, providing operational reporting, interactive visualizations, and AI-driven insights. It supports diverse data sources, offers no/low-code integration, ensures real-time governed analytics, and simplifies deployment and maintenance to streamline development and decision-making.
Logi Symphony Platforms
Windows
Web-Based
Linux
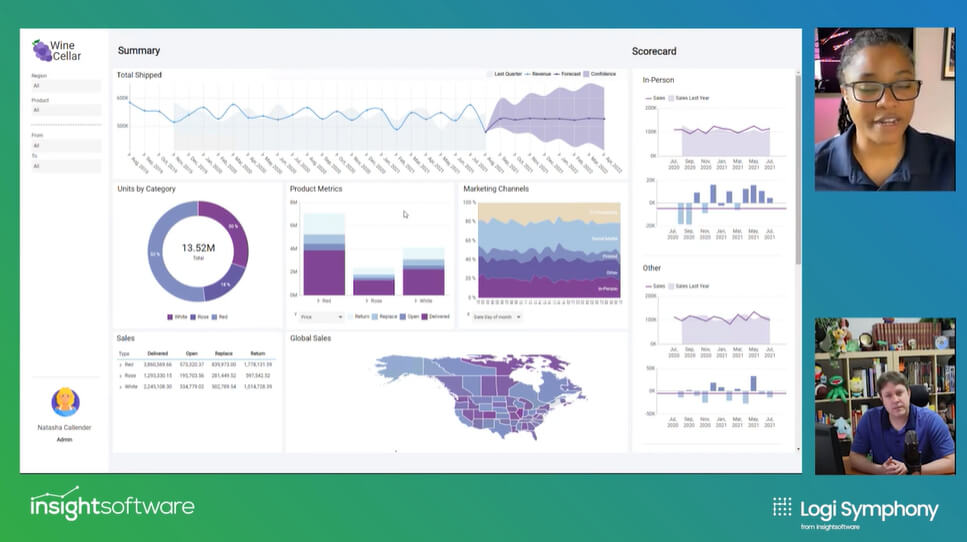
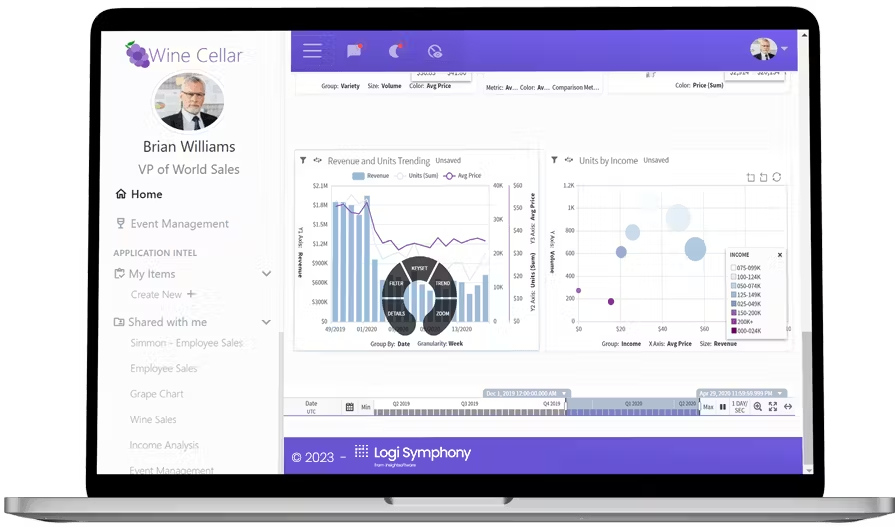
Logi Symphony Video and Screenshots
Logi Symphony Overview
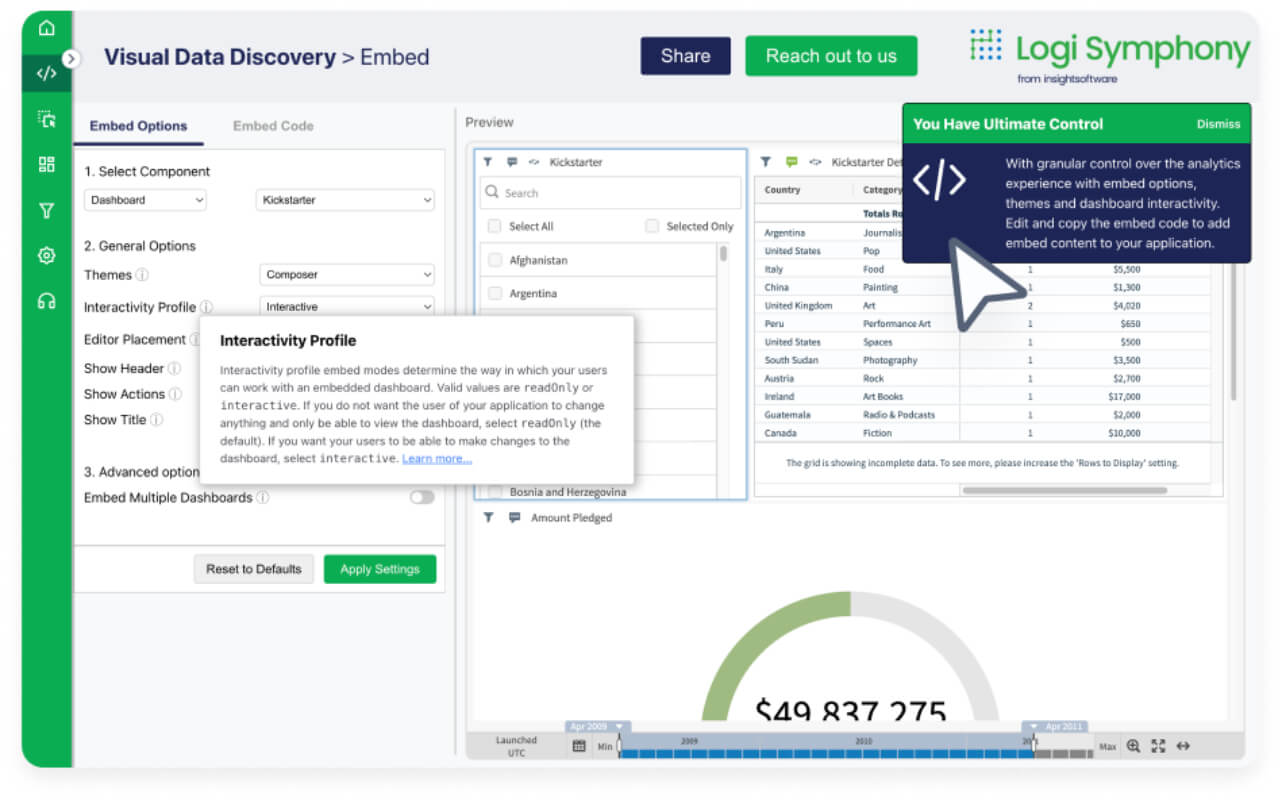
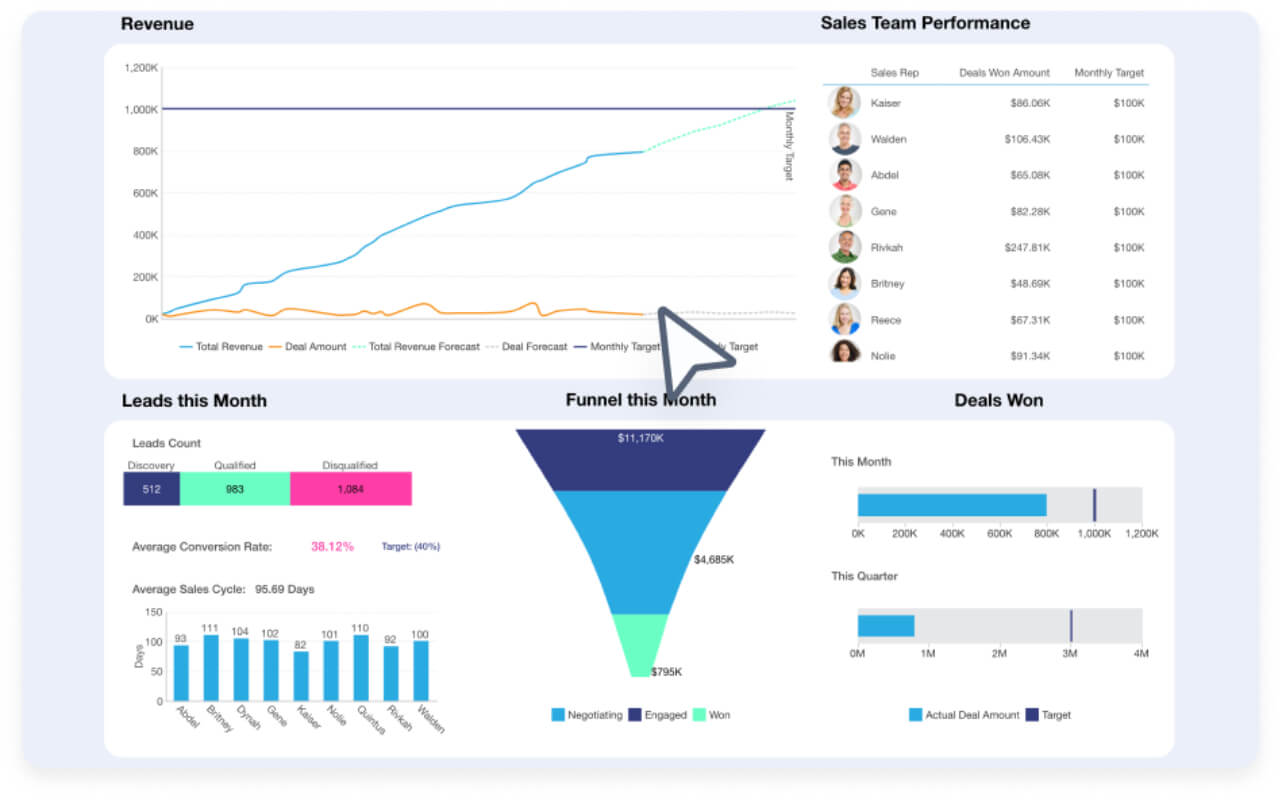
Logi Symphony is a business intelligence (BI) and analytics platform that enables organizations to embed data visualization, dashboards, and reporting within their applications. Its low-code development environment allows businesses to create interactive analytics experiences without extensive coding. With self-service BI tools, users can explore data, generate insights, and make data-driven decisions in real time.
The platform integrates seamlessly with various data sources, providing scalability for enterprises managing complex analytics. AI-driven insights and predictive analytics empower businesses to optimize operations and identify trends. With flexible deployment options, including cloud and on-premise, Logi Symphony supports organizations in delivering powerful analytics to users while maintaining security and compliance.