We've compiled a list of 30 free and paid alternatives to Google Data Studio. The primary competitors include Sisense, Tableau. In addition to these, users also draw comparisons between Google Data Studio and Power BI for Office 365, KiniMetrix, JetPack Data. Also you can look at other similar options here: Development Tools.
We've compiled a list of 30 free and paid alternatives to Google Data Studio. The primary competitors include Sisense, Tableau. In addition to these, users also draw comparisons between Google Data Studio and Power BI for Office 365, KiniMetrix, JetPack Data. Also you can look at other similar options here: Development Tools.
Business intelligence platform that provides data analytics and visualization solutions. It enables to analyze complex data sets and create interactive dashboards for better insights into their business performance. It also offers a range of feature…
Tableau is a powerful data visualization and business intelligence tool that allows you to analyze and visualize data in an interactive and meaningful way. It enables users to connect to various data sources, create dashboards, and share insights.
Data visualization and business intelligence (BI) platform for aggregating, sharing, collaborating...
Data visualization and business intelligence (BI) platform for aggregating, sharing, collaborating...
Google Data Studio Platforms
Web-Based
Google Data Studio Video and Screenshots
Google Data Studio Overview
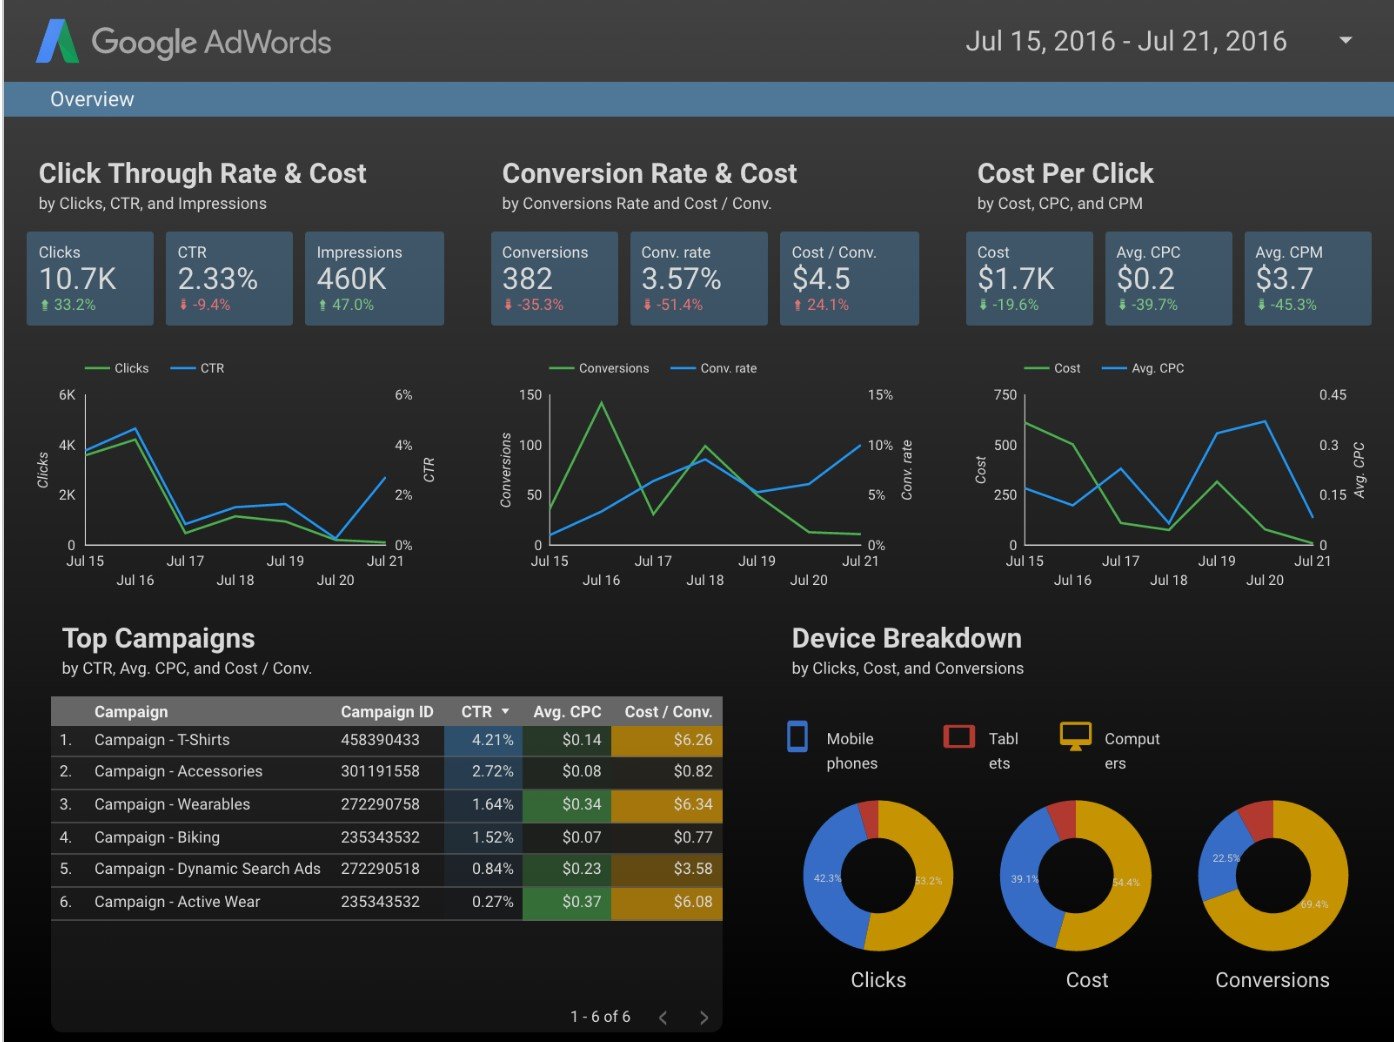
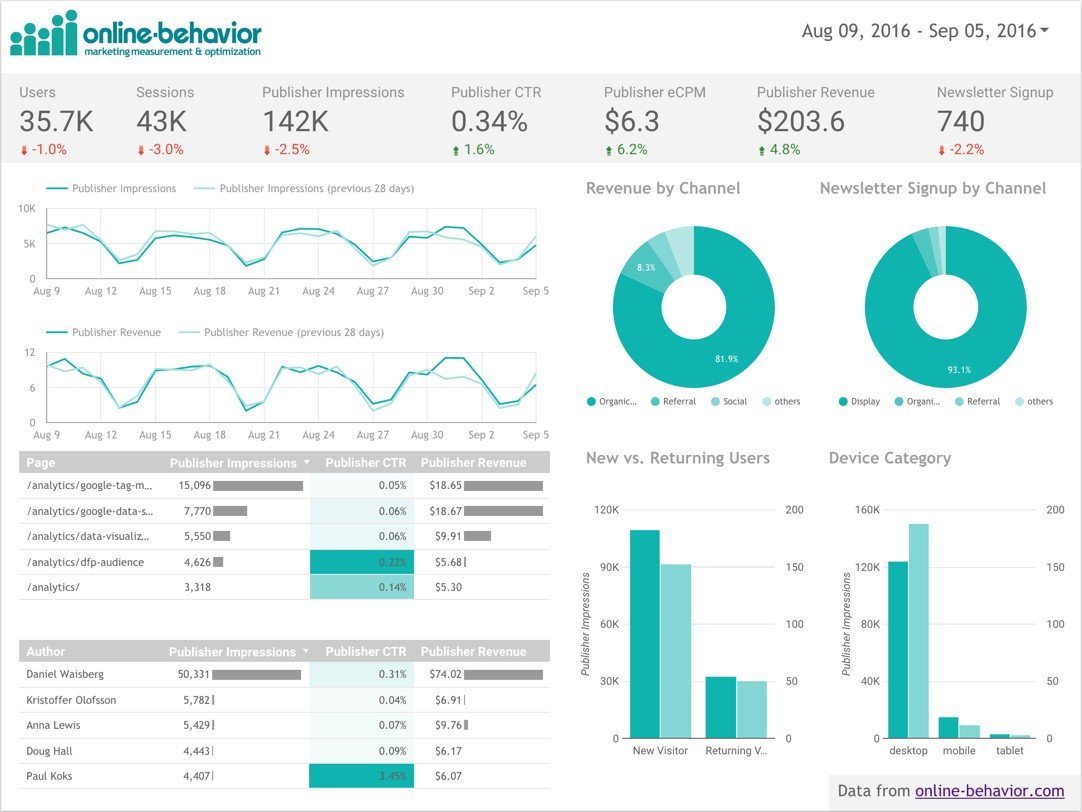
Google Data Studio turns your data into informative dashboards and reports that are easy to read, easy to share, and fully customizable. Dashboarding allows you to tell great data stories to support better business decisions.
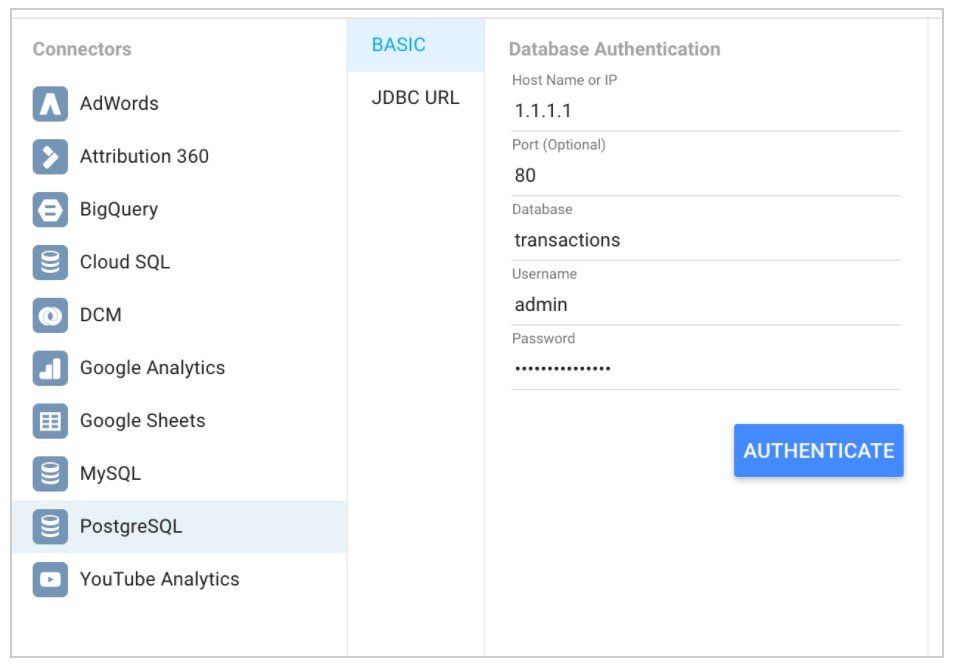
Data Studio provides easy access to all the data sources you need to understand your business and make better decisions. Regardless of whether you’re a business user or a data analyst, and no matter where the data lives, simply access it with a pre-built Data Studio connector. Data Studio handles the authentication, access rights, and structuring of the data. Once a data source is connected, the underlying dimensions and metrics are readily available for use in calculations, transformations, and visualizations.
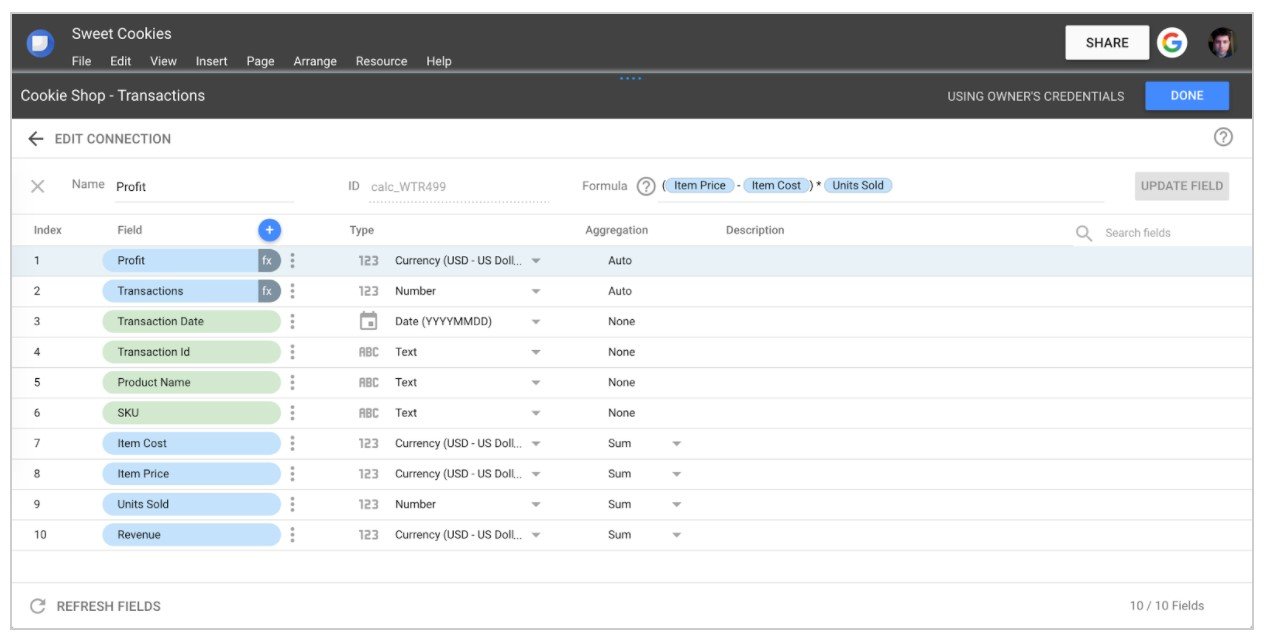
With Data Studio you’ll be able to transform your raw data into the metrics and dimensions needed to create easy-to-follow reports and dashboards. Simple solutions help you cleanse, combine, and transform all your data without writing code or creating SQL queries.
Data Studio provides:
- A visual editor for easy creation of reports and dashboards. - A rich library of visualizations to reveal the real story behind the data. - Fully custom design and style controls so you can make it your own. - Reusable templates for fast, professional reports every time. - Dynamic and interactive report controls based on time periods, geographies, segments, or any other dimension available in your data. - Seamless integration between data, analysis, and reporting for easy workflows. - All with built in sharing and collaboration - both within and outside the walls of your company.