Zabbix 대안
7373개의 무료 및 유료 대안을 Zabbix에 대한 목록으로 정리했습니다. 주요 경쟁 업체는 Wireshark, Box입니다. 이 외에도 사용자들은 Zabbix와 AIDA64, Postman, OpenShift 간에 비교를 하기도 합니다. 또한 여기서 다른 유사한 옵션을 살펴볼 수 있습니다: 시스템 및 하드웨어 도구.
73개의 무료 및 유료 대안을 Zabbix에 대한 목록으로 정리했습니다. 주요 경쟁 업체는 Wireshark, Box입니다. 이 외에도 사용자들은 Zabbix와 AIDA64, Postman, OpenShift 간에 비교를 하기도 합니다. 또한 여기서 다른 유사한 옵션을 살펴볼 수 있습니다: 시스템 및 하드웨어 도구.
AIDA64는 PC 애호가와 IT 전문가를 위한 종합적인 시스템 정보, 진단 및 벤치마킹 도구입니다. 상세한 컴퓨터 분석, 최적화된 벤치마크, 고급 하드웨어 모니터링 기능을 제공합니다. AIDA64 네트워크 감사 및 비즈니스 버전은 Windows 네트워크에 대한 IT 자산 관리, 원격 모니터링 및 하드웨어 진단을 제공하여 자세한 인벤토리 수집 및 변경 추적을 가능하게 합니다.
API를 구축, 테스트 및 관리할 수 있는 플랫폼. API 라이프사이클 전반에서 협업을 간소화하여 품질, 성능 및 보안을 향상시키며 팀의 효율성을 증대합니다.
OpenShift는 Red Hat의 무료 자동 스케일링 PaaS (Platform as a Service)입니다.
LogRocket은 웹 애플리케이션을 위한 종합적인 모니터링 및 디버깅 도구입니다. 사용자가 웹사이트에서 어떤 경험을 하는지 정확히 파악할 수 있어 문제를 빠르게 파악하고 해결할 수 있습니다.
Cloudways는 클라우드 호스팅 제공업체로, AWS, 구글 클라우드 플랫폼, 디지털오션, 리노드 등 다양한 클라우드 인프라를 통해 웹사이트 관리를 제공합니다. 웹사이트와 애플리케이션을 관리할 수 있는 간단한 인터페이스를 제공하여 웹 프로젝트를 쉽게 배포, 확장, 관리할 수 있습니다.
Site24x7은 웹사이트, 서버, 네트워크, 애플리케이션, 클라우드 플랫폼에 대한 실시간 모니터링을 제공합니다. 즉각적인 알림, AI 기반 이상 징후 탐지, 자동화된 인시던트 해결, 성능 최적화, 클라우드 비용 관리, 디지털 경험 향상을 위한 도구를 제공합니다.
SquaredUp은 플러그인 또는 웹 API를 통해 코드 저장소 및 고객 상호작용 시스템을 포함한 여러 데이터 소스와 통합되는 데이터 시각화 플랫폼입니다. 팀은 데이터를 탐색, 분석 및 시각화하여 이해관계자에게 인사이트와 KPI를 제공할 수 있으며, 롤업 아키텍처는 데이터 사일로를 제거하여 엔지니어링, 제품 및 IT 팀에 전체 기술 스택에 걸쳐 통합된 인사이트를 제공합니다.
Domotz는 IT 전문가와 MSP를 위한 네트워크 모니터링 솔루션으로, IT 인프라에 대한 실시간 가시성과 관리 기능을 제공합니다. 네트워크 구성 관리, 원격 장치 액세스, SNMP 모니터링, 진단, 팀 협업 도구 등의 기능이 포함되어 있어 성능을 향상하고 투명성을 보장합니다.
Gather and analyze accurate statistics and performance metrics, visualize it, get notified about...
Gather and analyze accurate statistics and performance metrics, visualize it, get notified about...
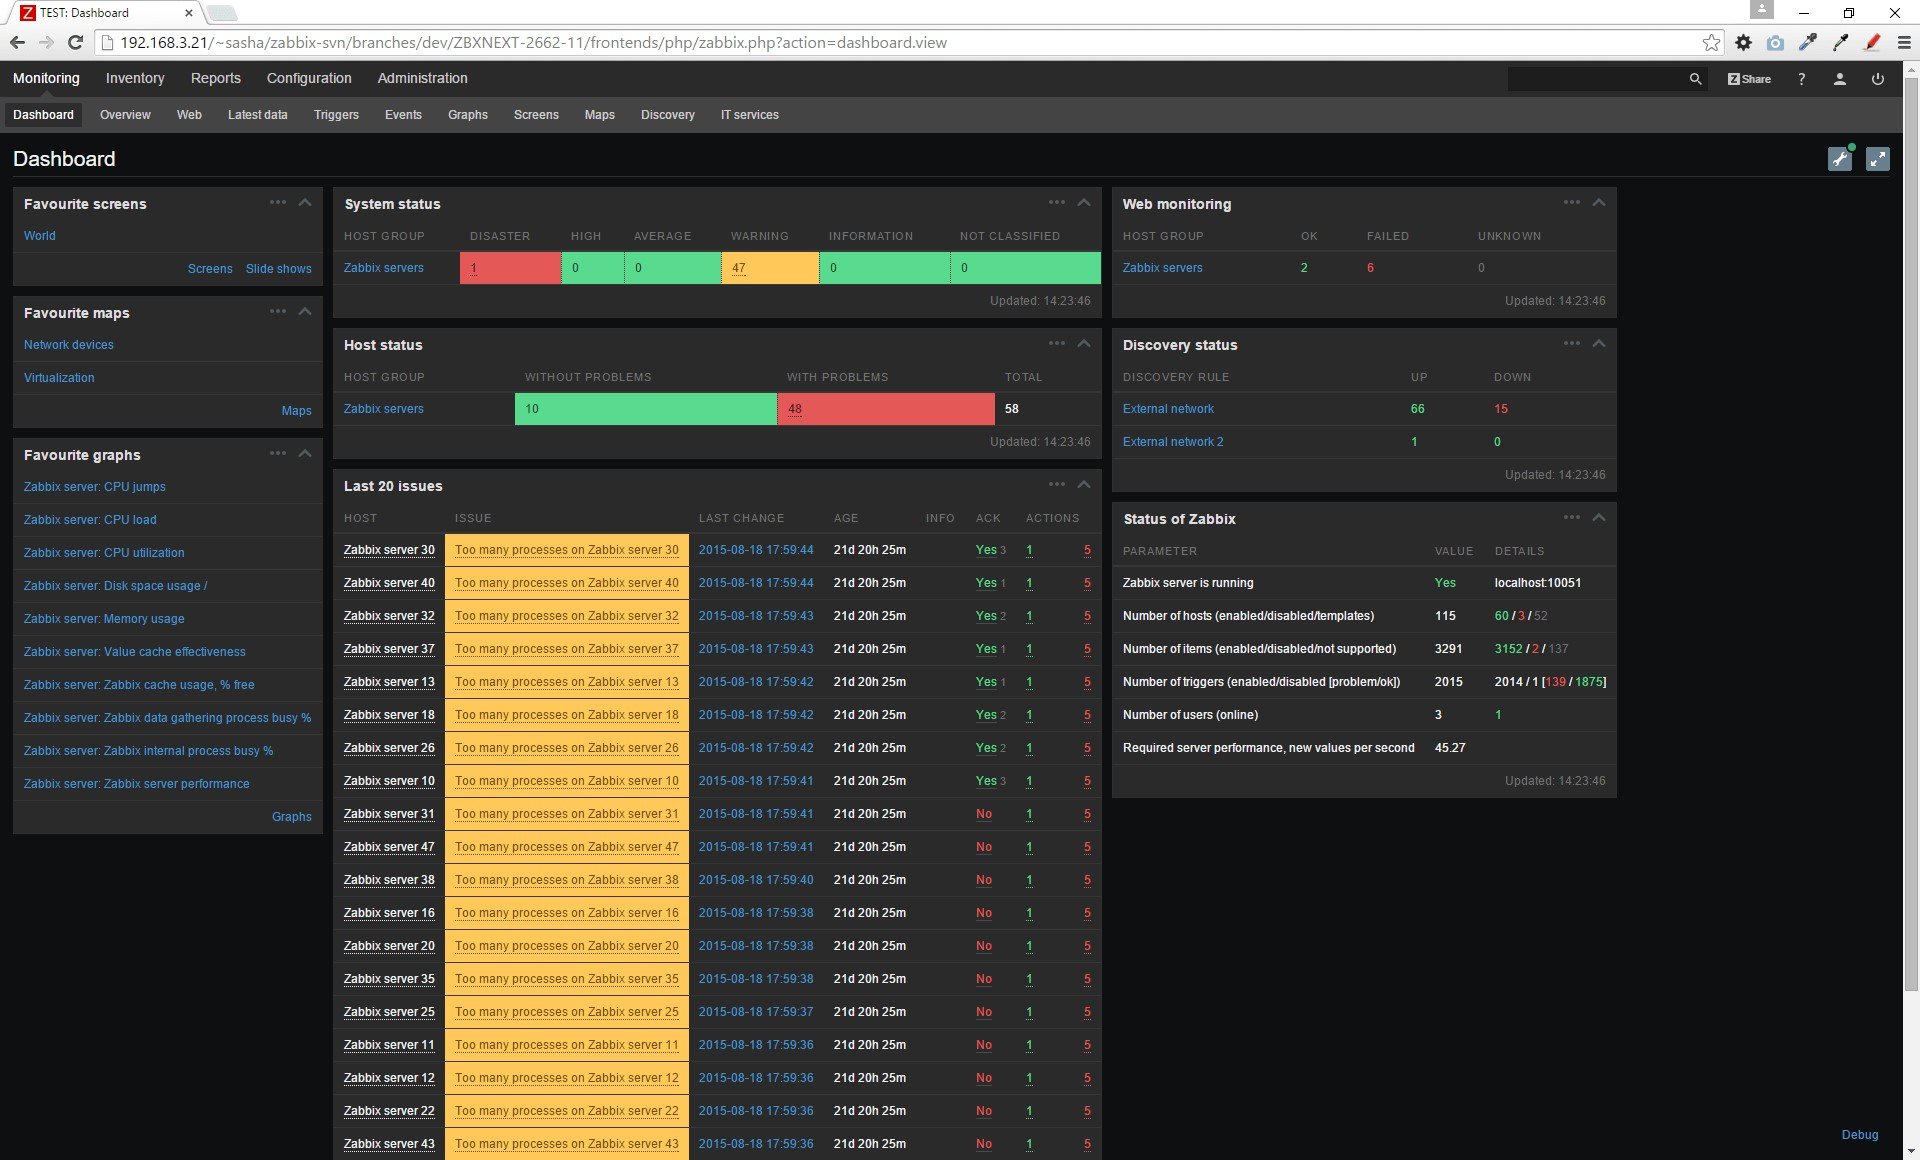
An uncompromising mature enterprise-level platform designed for real-time monitoring of millions of metrics collected from tens of thousands of servers, virtual machines and network devices, effortlessly scaling to even larger environments.
Gather and analyze accurate statistics and performance metrics, visualize it, get notified about current and potential issues without delay, and take advantage of our time-tested professional development and support.
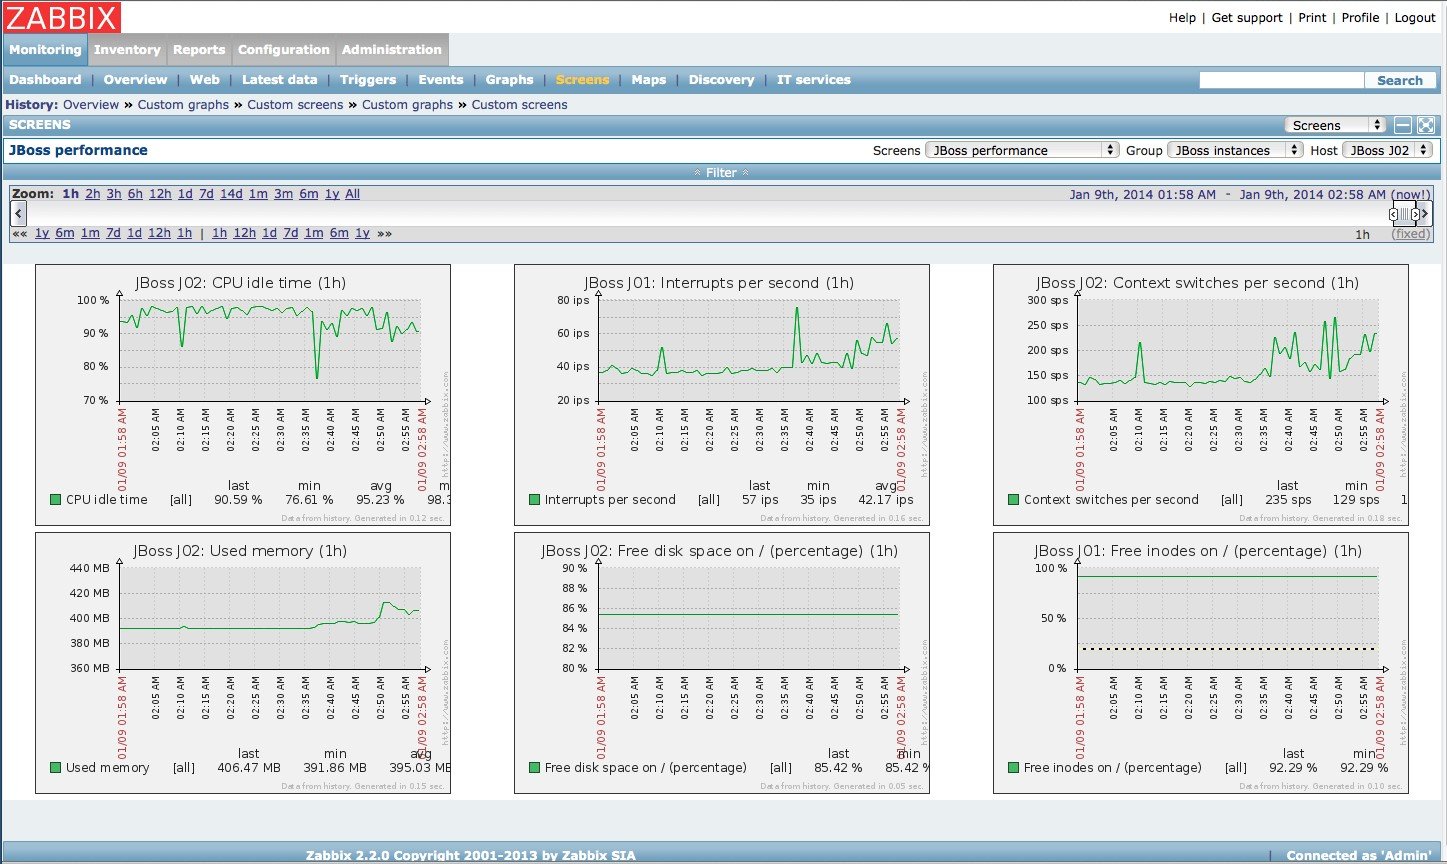
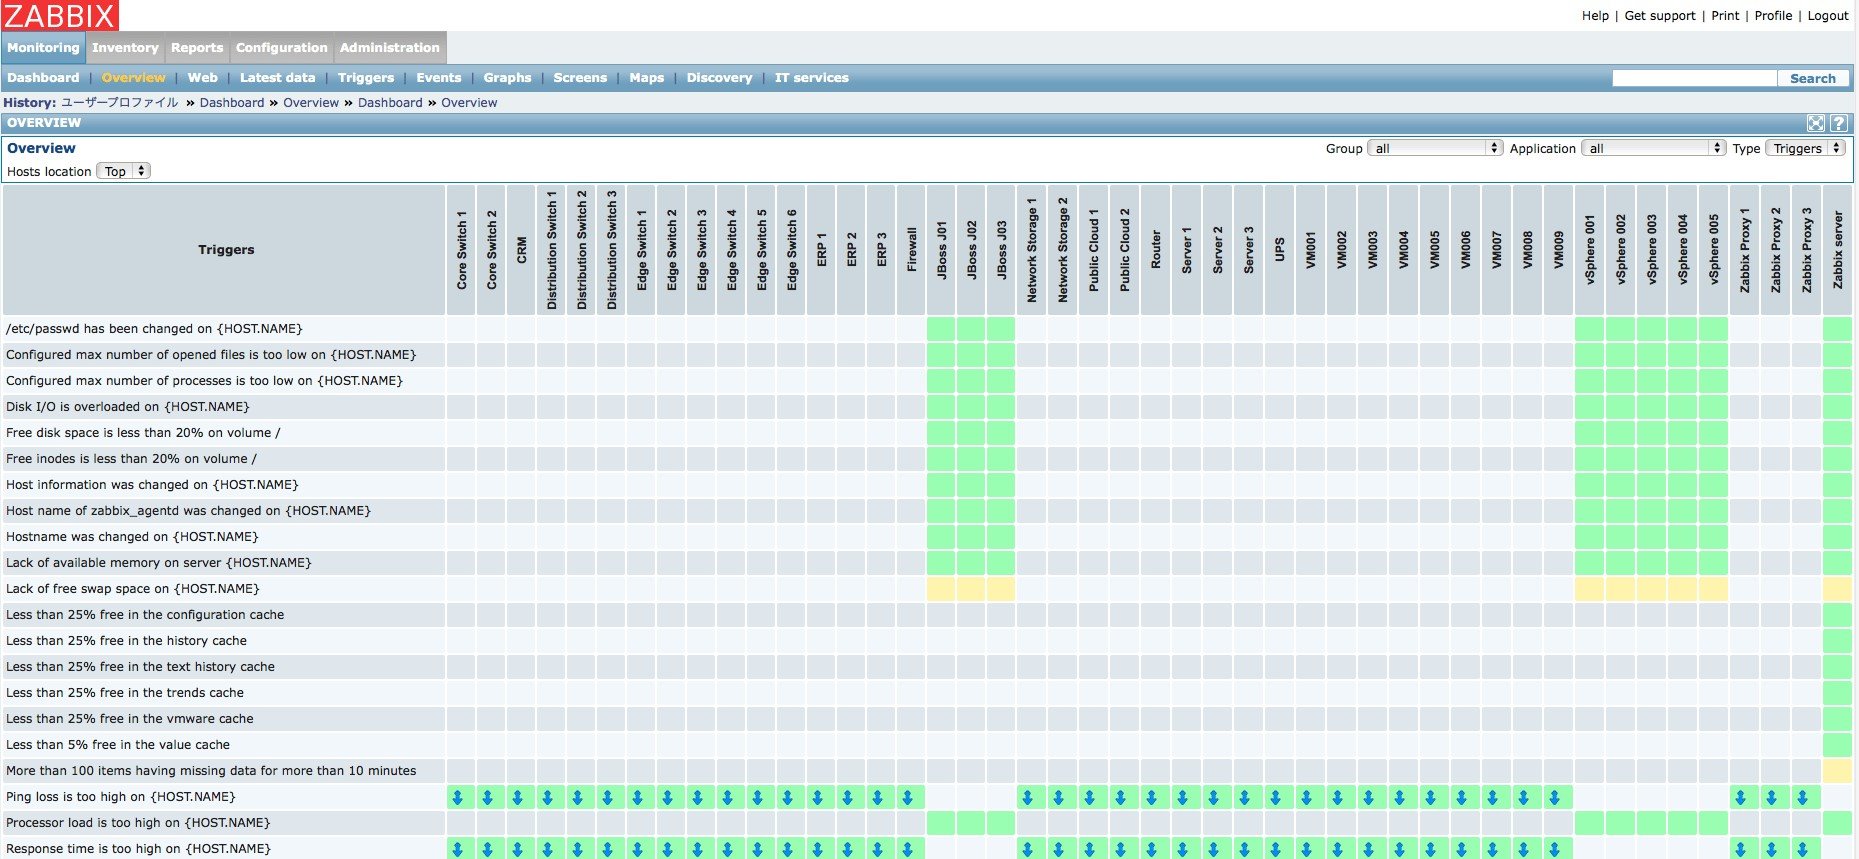
Along with storing the data, visualization features are available (overviews, maps, graphs, screens, etc), as well as very flexible ways of analyzing the data for the purpose of alerting.
Thresholds of acceptable limits for incoming data can be set. As soon as those thresholds are surpassed, Zabbix can deliver e-mail notifications informing network administrators about the current or a potential problem.
Zabbix offers great performance for data gathering and can be scaled to very large environments. Distributed monitoring options are available with the use of Zabbix proxies. Zabbix comes with a web-based interface, secure user authentication and a flexible user permission schema. Polling and trapping is supported, with native high performance agents gathering data from virtually any popular operating system; agent-less monitoring methods are available as well.
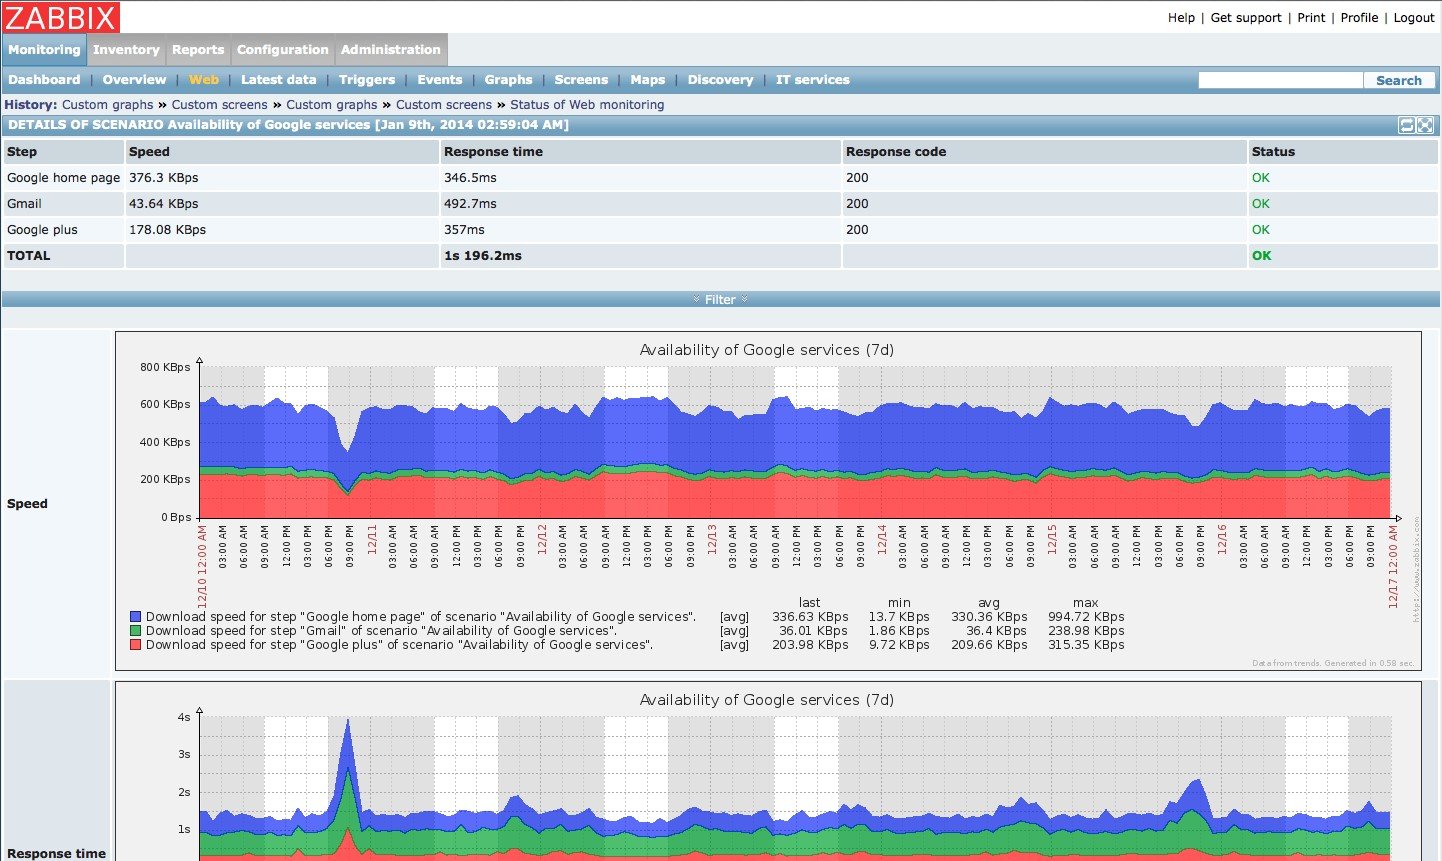
Web monitoring as well as monitoring of WMware virtual machines is possible with Zabbix. Zabbix can automatically discover network servers and devices, as well as perform low-level discovery with methods of automatically assigning performance and availability checks to discovered entities.
There are many reasons to choose the Zabbix solution over its competitors. The best way to make sure it is the #1 choice for your organization is to give it a try
소프트웨어에 대한 의견을 공유하고 리뷰를 남겨 더 나아지도록 도와주세요!
변경 제안
귀하의 의견
Your vote has been counted.
Do you have experience using this software?
