Logi Symphony is BI software that integrates advanced analytics into applications, providing operational reporting, interactive visualizations, and AI-driven insights. It supports diverse data sources, offers no/low-code integration, ensures real-ti…
Sigma Computing is a cloud-based BI platform for scalable data analysis, combining spreadsheets, SQL, Python, and AI. It features real-time collaboration, secure data entry, and embedded analytics. Key tools include generative AI, machine learning i…
Yellowfin is an enterprise analytics platform that streamlines data workflows, offering tools for data preparation, dashboard creation, and reporting. It offers action-based dashboards, automated monitoring, data storytelling, and no-code/low-code t…
Visual data platform that transforms complex business data into insights. Enables discovery through visualizations, helping identify trends and patterns crucial for decision-making.
MATLAB is a proprietary programming language and computing environment for numeric analysis, algorithm development, data visualization, and matrix manipulation. It supports interfacing with other languages, creating user interfaces, and is widely us…
SAP Crystal Reports is a business intelligence tool for creating, designing, and delivering formatted, dynamic reports from various data sources. It offers high-quality documents, embedded images, and barcodes, with flexible sharing and exporting op…
GoodData is a cloud-based, AI-powered data analytics platform designed to help businesses transform data into valuable insights. Specializing in composable data and analytics, GoodData's platform enables customers to develop and scale diverse data u…
It has a wide range of functions aimed at processing, visualizing, and analyzing scientific and engineering data. It also supports graphing, statistical analysis, signal processing, function approximation, spectrum work, and much more.
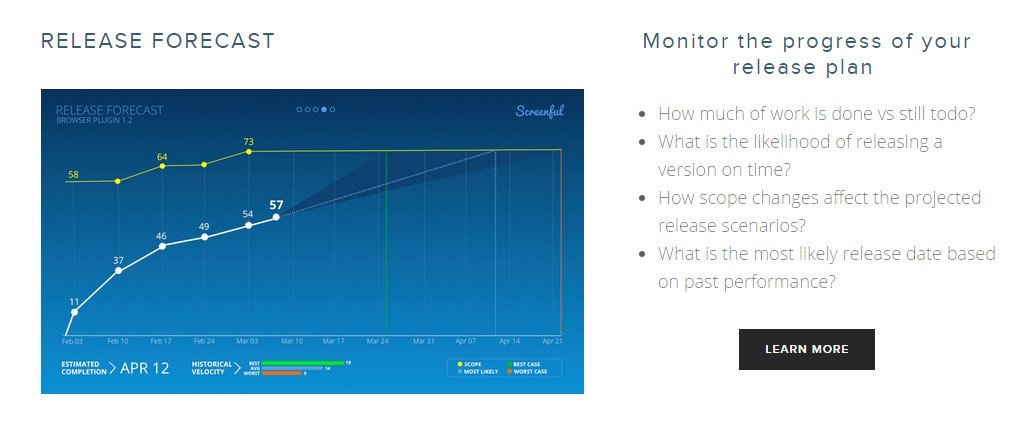
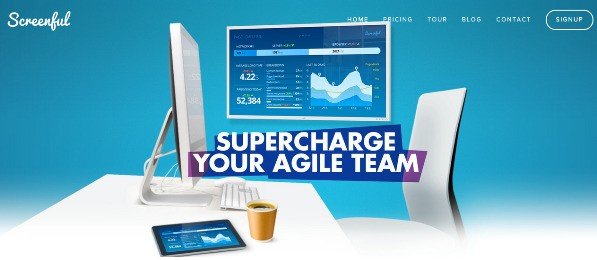
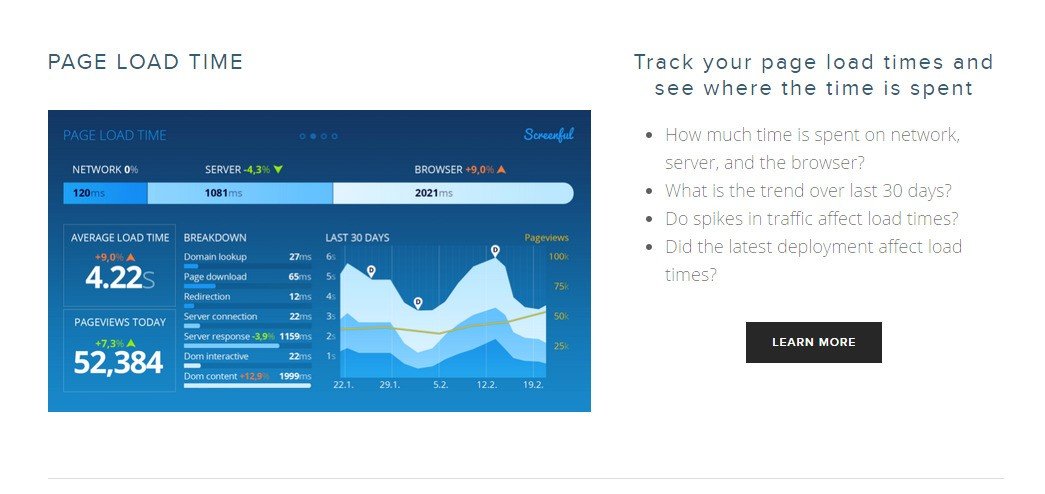
Screenful is a set of dashboards that keeps your team constantly informed of their progress. Get quick overview of your development status by swiping through the screens on your smartphone or tablet. Maximize the feedback that your team gets by installing a large visible display.
Why is it needed?
Tracking metrics is essential for successful project delivery as it enables you to foresee any possible issues so that you can take action proactively, rather than do firefighting later.
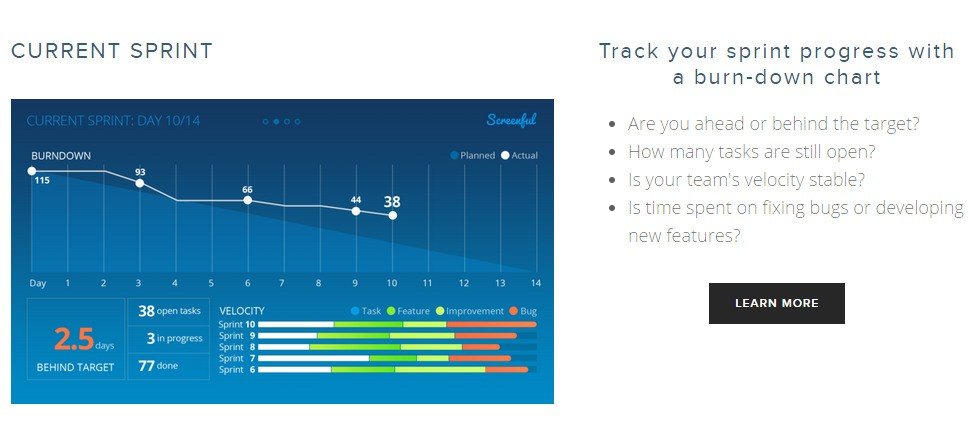
Who is it for?
The screens improve communication between all stakeholders in Agile development including Scrum masters, developers, Product owner, QA, and even the customer.
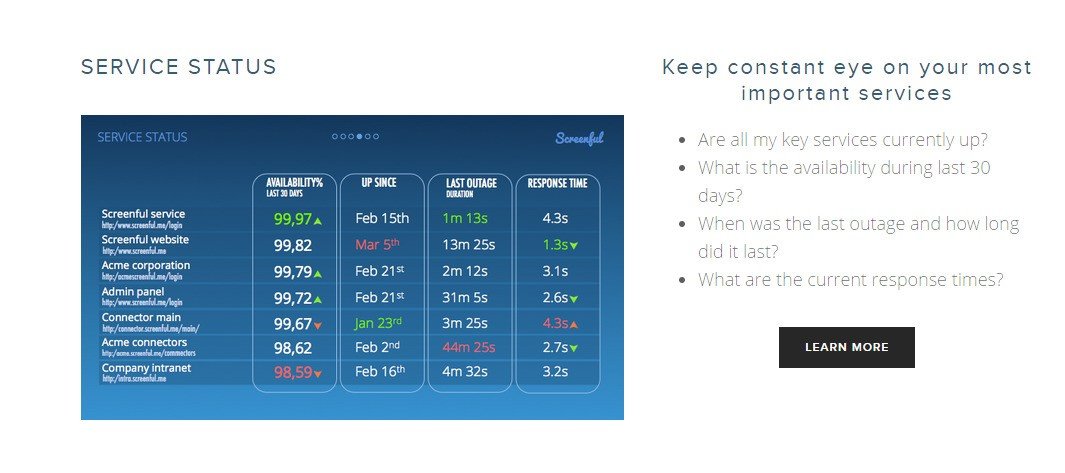
What makes it stand out from the crowd?
We have designed our dashboard for a narrow target group i.e. agile teams, whose needs are not properly covered with the current solutions on the market (due to their nature as platforms rather than out-of-the-box-solutions, they are not built to serve the needs of software developers specifically). Another differentiator is that we’re focusing on large visible screens and our content is designed to meet that specific use case.
What’s our plans for the future?
We’ll be launching our product as a SaaS service, which our customers can self-provision through our website. We’ll be also adding new integrations with not only task management tools but also for test and build tools for example. We want to provide comprehensive view for the application development lifecycle.