Miro is an online tool for collaborating and visualizing ideas. It provides the ability to create interactive whiteboards where users can collaborate, add cards, images, comments, and other objects.
Your go-to visual collaboration and diagramming hub. Promotes company-wide coherence and collaboration. Offers boundless whiteboarding, robust diagramming, and compatibility with favorite tools.
Offers intuitive diagramming tools for communication and collaboration. Create professional diagrams like flowcharts and UML diagrams with drag-and-drop features. Ideal for Confluence, Jira, or standalone use.
Simplifies flowchart and process map creation with intuitive templates and symbols. Seamlessly integrate with MS Office, GSuite, and more for efficient collaboration. Import and export Visio files.
A design tool that allows businesses to create and share multimedia content. With customizable templates, access to Adobe Stock images and fonts, you can create social media posts, flyers, banners and logos.
Power BI, a component of the Microsoft Power Platform, is a comprehensive business intelligence and self-service analytics solution that empowers users to visualize and analyze data from multiple sources. It provides features such as data modeling, …
Quadrigram is an online data visualization and presentation tool designed to create interactive and engaging presentations. It features a drag-and-drop editor that combines texts, images, and interactive visualizations to bring data to life, allowing users to easily share insights through articles, presentations, or embedded visualizations.
Quadrigram is an online data visualization and presentation tool designed to create interactive and engaging presentations. It features a drag-and-drop editor that combines texts, images, and interactive visualizations to bring data to life, allowing users to easily share insights through articles, presentations, or embedded visualizations.
Quadrigram Platforms
Linux
Mac
Web-Based
Windows
Quadrigram Video and Screenshots
Quadrigram Overview
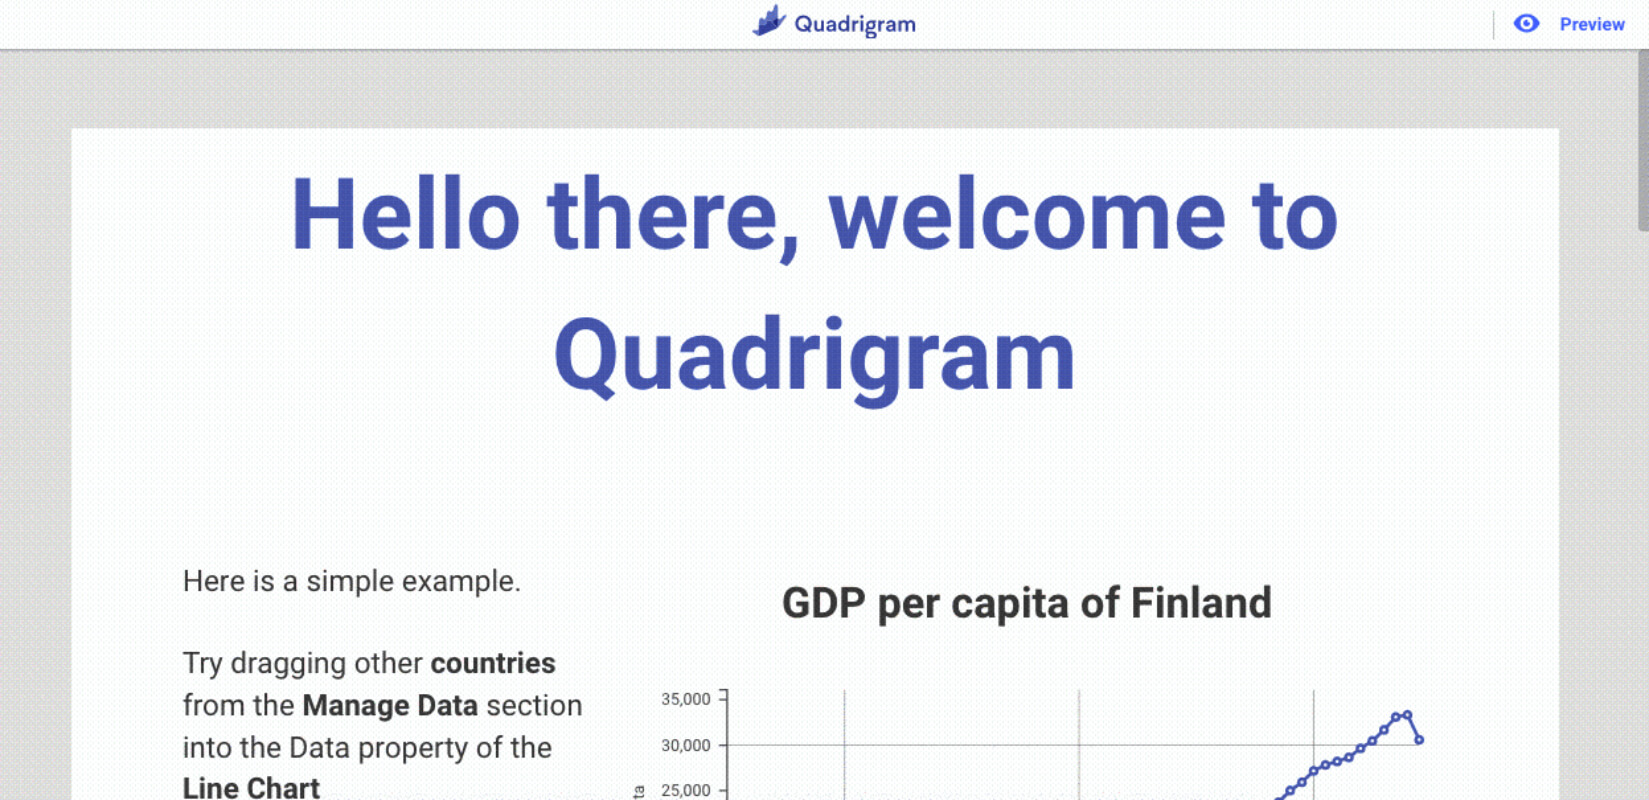
Quadrigram is a user-friendly visual data editor that allows users to create interactive, data-driven presentations without any coding experience. By using a simple drag-and-drop interface, users can combine text, images, and interactive elements to create engaging stories from their data. It supports file formats like XLS and CSV, which can be easily uploaded from Google Drive. This makes it simple for users to transform raw data into compelling visual narratives.
The platform’s main advantage is its ease of use and accessibility. Quadrigram enables anyone, regardless of technical background, to create professional-quality visualizations. Its intuitive interface and comprehensive tutorials help users get started quickly, while its focus on privacy ensures that uploaded data is not stored. Overall, Quadrigram is a valuable tool for anyone looking to present data in a visually appealing and accessible way.