We've compiled a list of 21 free and paid alternatives to Prometheus. The primary competitors include SquaredUp, New Relic. In addition to these, users also draw comparisons between Prometheus and Sysdig, LogicMonitor, checkmk. Also you can look at other similar options here: System and Hardware Tools.
We've compiled a list of 21 free and paid alternatives to Prometheus. The primary competitors include SquaredUp, New Relic. In addition to these, users also draw comparisons between Prometheus and Sysdig, LogicMonitor, checkmk. Also you can look at other similar options here: System and Hardware Tools.
SquaredUp is a data visualization platform that integrates with multiple data sources, including code repositories and customer interaction systems, through plugins or a Web API. It enables teams to explore, analyze, and visualize data, providing in…
New Relic is a cloud-based observability platform that helps engineers and developers visualize, analyze, and troubleshoot their software using data throughout the lifecycle. It offers full-stack monitoring, collaboration tools, security features, a…
Sysdig is a cloud security platform that offers real-time threat detection, vulnerability assessment, and posture management, leveraging AI-driven contextual analysis and the Cloud Attack Graph to prioritize risks, identify misconfigurations, and en…
LogicMonitor is a cloud-based infrastructure monitoring platform that offers AI-powered hybrid observability through its SaaS-based platform, LM Envision. It provides operational visibility and predictability across on-prem and multi-cloud environme…
Checkmk is a scalable infrastructure and application monitoring platform that provides a comprehensive view of your IT infrastructure, including cloud providers, data centers, servers, networks, and containers. With over 2,000 plugins, auto-discover…
YunoJuno is a comprehensive platform designed to streamline the process of sourcing, onboarding, managing, and paying global contractors. It simplifies freelance workforce management, reduces costs, and ensures full compliance. YunoJuno provides dir…
Maximize engineering performance with Jellyfish Engineering Management Platform. Integrate tools like Jira and GitHub to measure, optimize, and communicate the impact of your team's efforts. Drive strategic alignment and enable continuous improvemen…
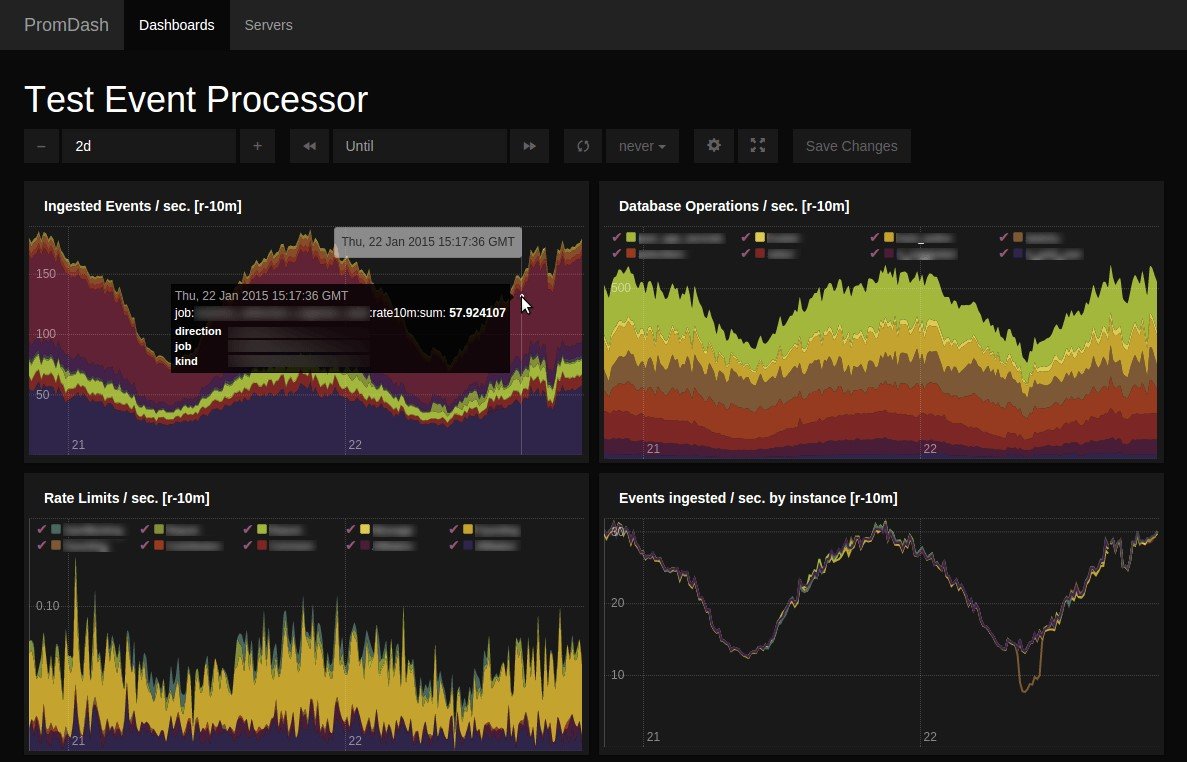
Prometheus is an open-source systems monitoring and alerting toolkit originally built at SoundCloud. Since its inception in 2012, many companies and organizations have adopted Prometheus, and the project has a very active developer and user community. It is now a standalone open source project and maintained independently of any company.
Prometheus's main features are:
- A multi-dimensional data model (time series identified by metric name and key/value pairs). - A flexible query language to leverage this dimensionality. - No reliance on distributed storage; single server nodes are autonomous. - Time series collection happens via a pull model over HTTP. - Pushing time series is supported via an intermediary gateway. - Targets are discovered via service discovery or static configuration. - Multiple modes of graphing and dashboarding support.