We've compiled a list of 15 free and paid alternatives to Grafana. The primary competitors include New Relic, checkmk. In addition to these, users also draw comparisons between Grafana and netdata, Prometheus, Scalyr. Also you can look at other similar options here: Network and Admin Software.
We've compiled a list of 15 free and paid alternatives to Grafana. The primary competitors include New Relic, checkmk. In addition to these, users also draw comparisons between Grafana and netdata, Prometheus, Scalyr. Also you can look at other similar options here: Network and Admin Software.
New Relic is a cloud-based observability platform that helps engineers and developers visualize, analyze, and troubleshoot their software using data throughout the lifecycle. It offers full-stack monitoring, collaboration tools, security features, a…
Checkmk is a scalable infrastructure and application monitoring platform that provides a comprehensive view of your IT infrastructure, including cloud providers, data centers, servers, networks, and containers. With over 2,000 plugins, auto-discover…
Atatus is an all-in-one observability platform offering comprehensive full-stack monitoring for apps, websites, servers, and logs. It provides immediate, actionable insights to diagnose and resolve performance issues, ensuring optimal digital experi…
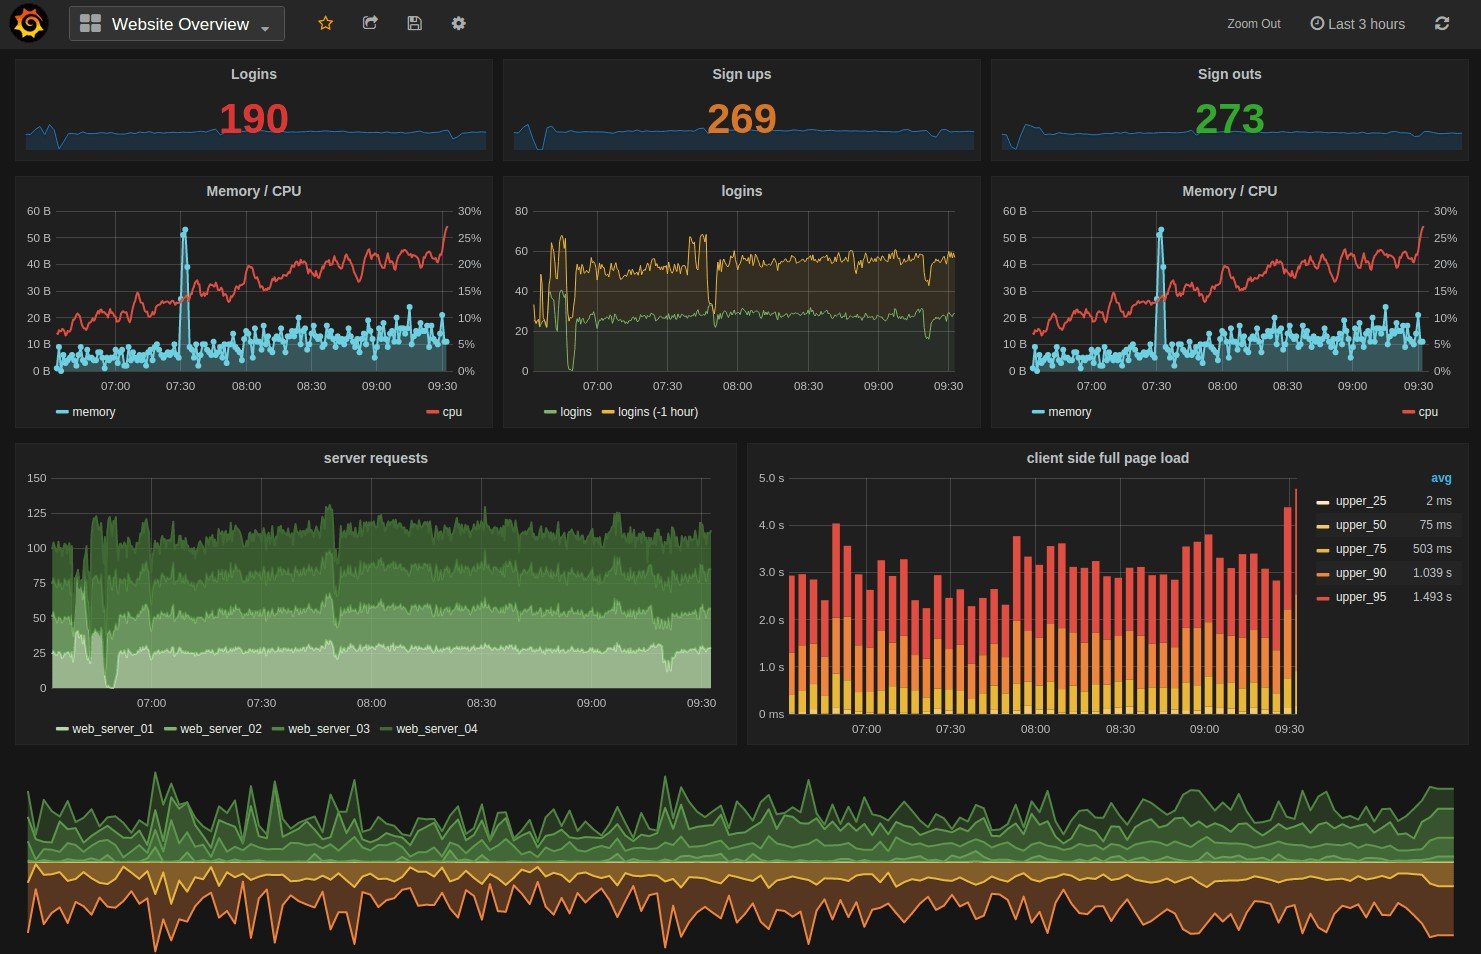
Grafana provides a powerful and elegant way to create, explore, and share dashboards and data with your team and the world.
Grafana is most commonly used for visualizing time series data for Internet infrastructure and application analytics but many use it in other domains including industrial sensors, home automation, weather, and process control.
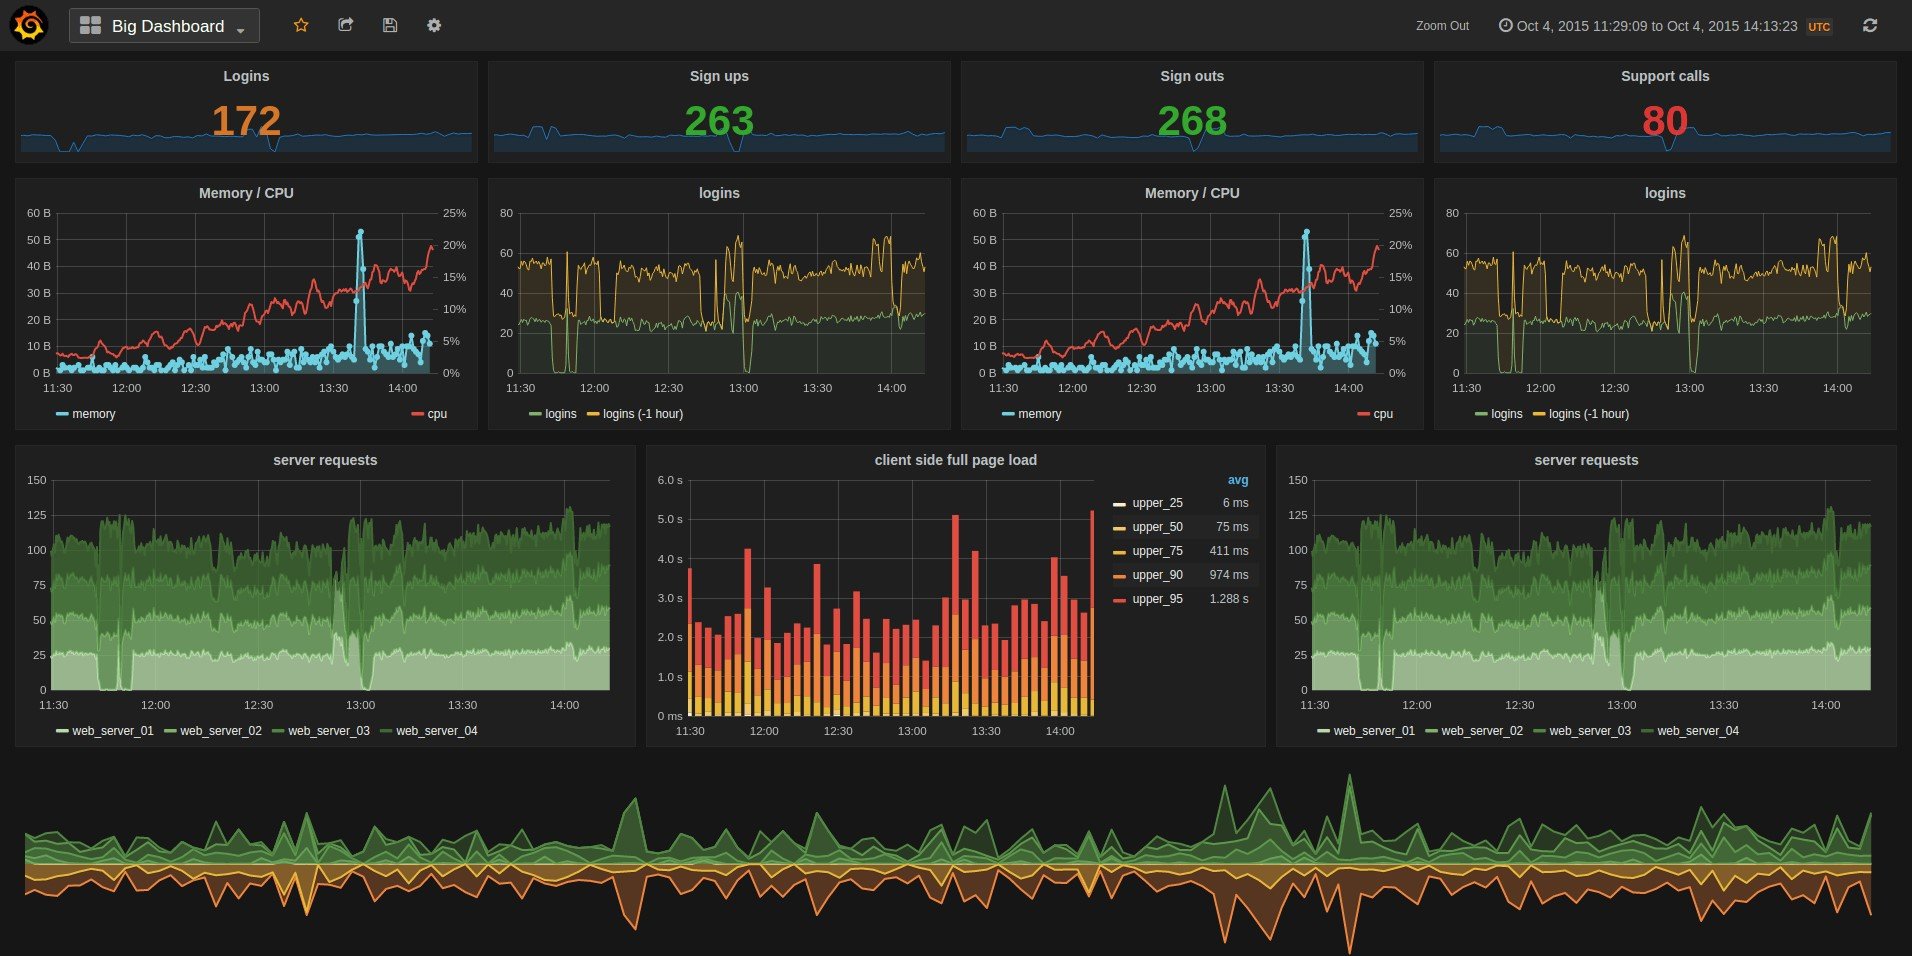
Grafana works with Graphite, Elasticsearch, Cloudwatch, Prometheus, InfluxDB & More.
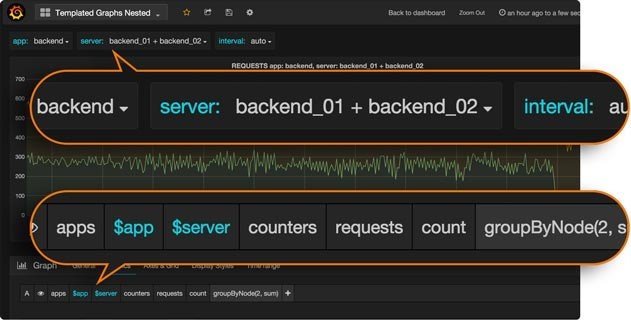
Grafana features pluggable panels and data sources allowing easy extensibility and a variety of panels, including fully featured graph panels with rich visualization options. There is built in support for many of the most popular time series data sources.