We've compiled a list of 53 free and paid alternatives to Origin. The primary competitors include GnuPlot, python(x,y). In addition to these, users also draw comparisons between Origin and Graph, Plotly, QtiPlot. Also you can look at other similar options here: About.
We've compiled a list of 53 free and paid alternatives to Origin. The primary competitors include GnuPlot, python(x,y). In addition to these, users also draw comparisons between Origin and Graph, Plotly, QtiPlot. Also you can look at other similar options here: About.
Data analysis and graphing software for scientists and engineers.
Data analysis and graphing software for scientists and engineers.
Origin Platforms
Web-Based
Origin Video and Screenshots
Origin Overview
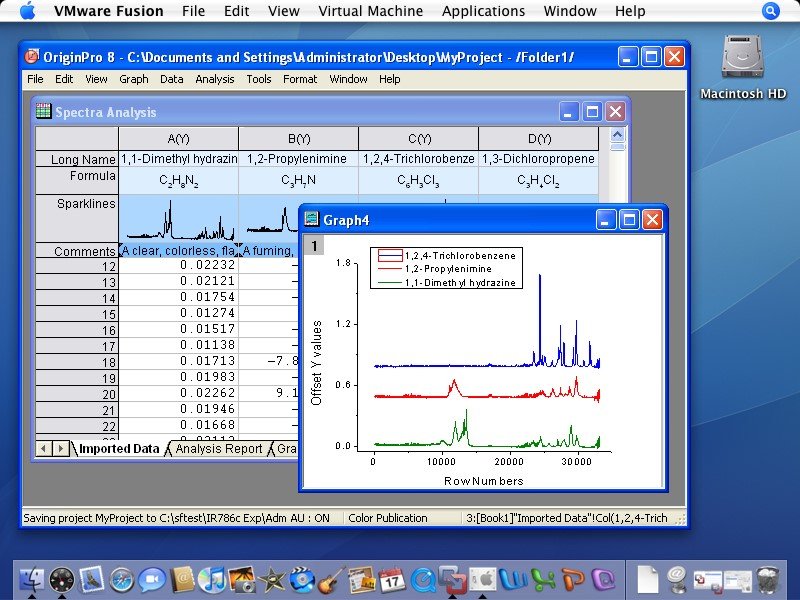
Data analysis and graphing software for scientists and engineers. It provides You with dozens of functionalities and options. The plotting engine is very effective and the plots are of high quality. A lot of statistical functionalities make data analysis very easy even for those who dont have a a Ph.D.
Origin offers unique peak-analysis and curve-fitting capabilities, over 60 customizable graph types, and analysis templates, all within a tightly integrated workbook environment.
Top 10 New Features in Origin 8.1
1. Gadgets: Quickly Fit and Analyze Graphed Data (SR2) 2. Batch Processing of Multiple Files or Datasets with Summary Report 3. Batch Peak Analysis (OriginPro) 4. Slide Show of Graphs and Favorites Folder in Project Explorer with Support for Shorcuts 5. Export Multiple Graphs to PowerPoint 6. Password Protection of Origin Projects and Audit Log on Project Saving 7. New Graph Types: Ternary Contour, Weibull Probability, Windrose, Multi-Axes Plotting Tool 8. Data Reduction Tools, and Data Rearrangement Tools, Including Pivot Table 9. Signal Decimation, Rise and Fall Time Analysis, Signal Envelopes (OriginPro) 10. Custom Menu Configuration and Support for User-Defined LabTalk Script Functions