We've compiled a list of 8 free and paid alternatives to ggraptR. The primary competitors include R (programming language), RStudio. In addition to these, users also draw comparisons between ggraptR and Rattle, Deducer, BlueSky Statistics. Also you can look at other similar options here: About.
We've compiled a list of 8 free and paid alternatives to ggraptR. The primary competitors include R (programming language), RStudio. In addition to these, users also draw comparisons between ggraptR and Rattle, Deducer, BlueSky Statistics. Also you can look at other similar options here: About.
ggraptR is an open source R package providing a GUI for visualization.
ggraptR is an open source R package providing a GUI for visualization.
ggraptR Platforms
Linux
Web-Based
Windows
ggraptR Video and Screenshots
ggraptR Overview
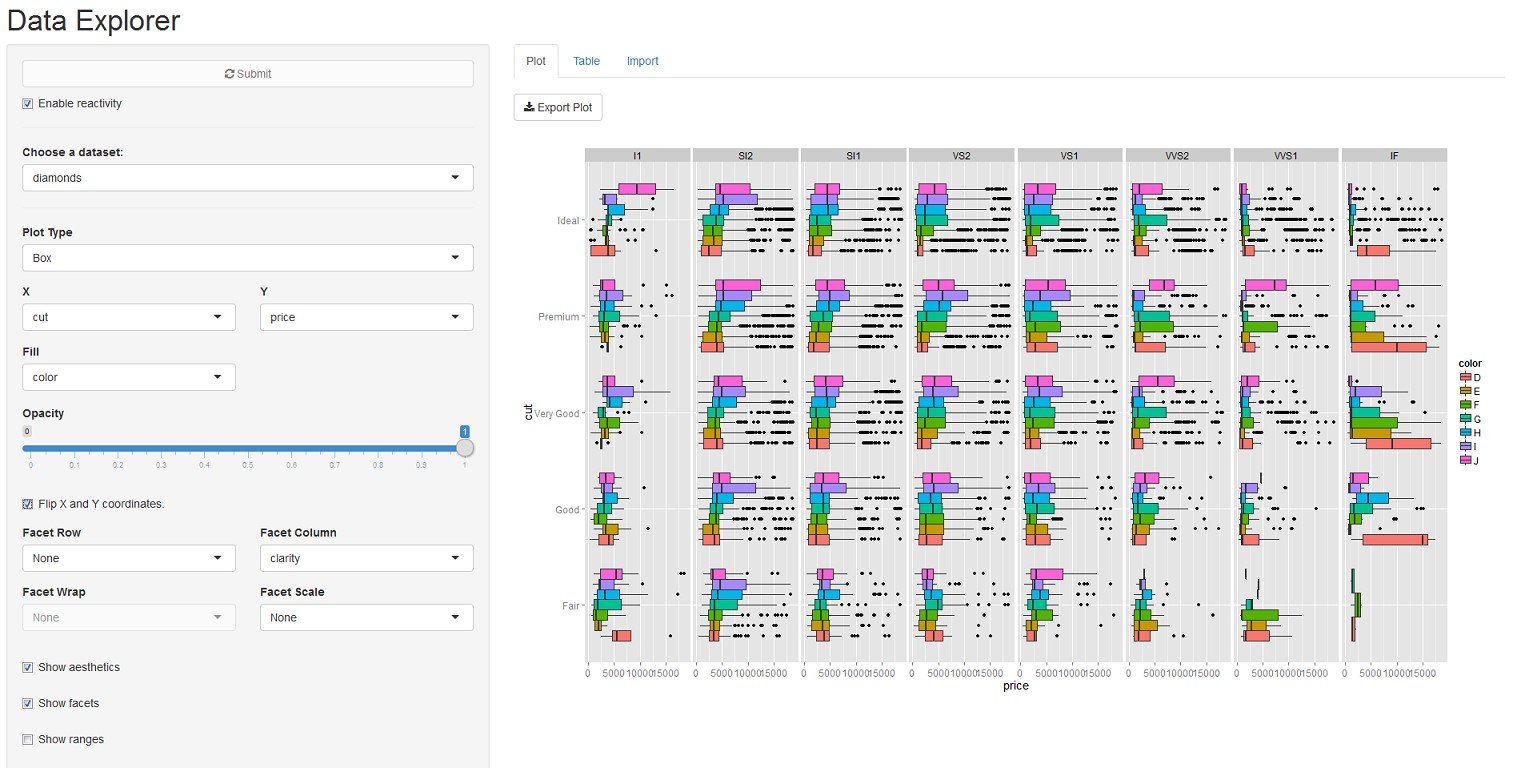
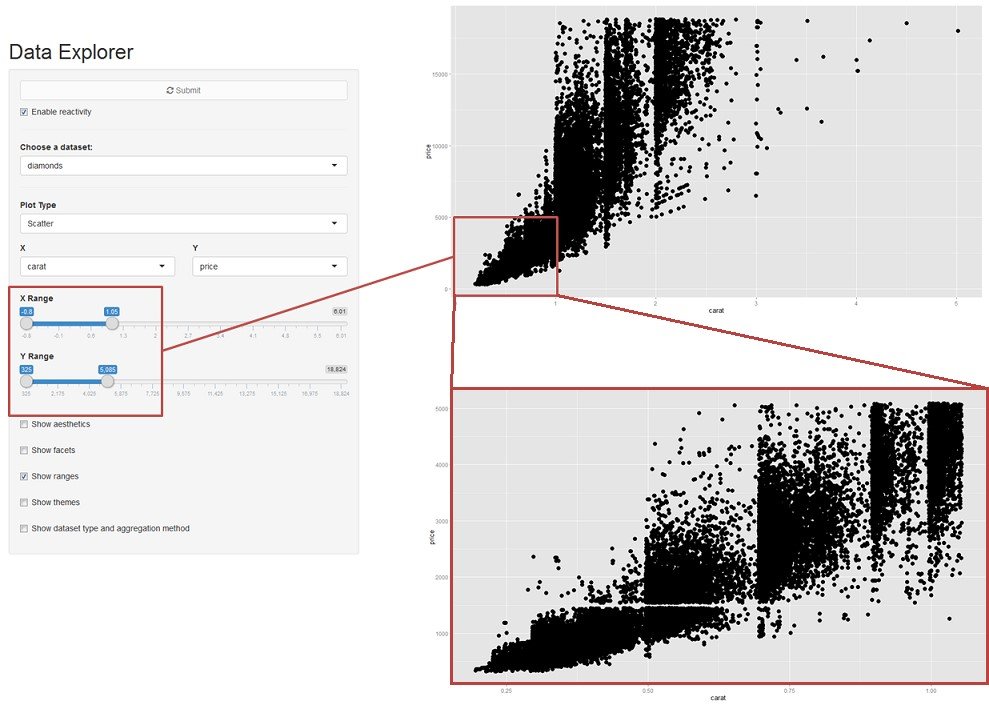
ggraptR is an open source R package providing a graphical user interface for data exploration and visualisation. It is based on principles of visualization analysis by Tamara Munzner, and also acts as a wrapper for functionality implemented in the grammar of graphics for R, ggplot2.
ggplot2 offers a wide array of marks and channels that constitute the building blocks for developing visual encodings, as well as a large selection of built-in visual idioms. However, users unfamiliar with the package may not have visibility of the options available to them, or find it challenging to express their envisioned design in their desired visual idiom.
ggraptR is designed to handle a spectrum of data visualisation needs ranging from visualising the raw values of individual variables through to fully aggregated, pivot-table style visualisations. Data volume and visual complexity is handled by the implementation of two approaches to handle visual complexity - faceting into multiple views, and reduction of items and attributes.