EJSCharts 대안
4040개의 무료 및 유료 대안을 EJSCharts에 대한 목록으로 정리했습니다. 주요 경쟁 업체는 RAWGraphs, Chart.js입니다. 이 외에도 사용자들은 EJSCharts와 NVD3, Plotly, ApexCharts 간에 비교를 하기도 합니다. 또한 여기서 다른 유사한 옵션을 살펴볼 수 있습니다: 개발 도구.
40개의 무료 및 유료 대안을 EJSCharts에 대한 목록으로 정리했습니다. 주요 경쟁 업체는 RAWGraphs, Chart.js입니다. 이 외에도 사용자들은 EJSCharts와 NVD3, Plotly, ApexCharts 간에 비교를 하기도 합니다. 또한 여기서 다른 유사한 옵션을 살펴볼 수 있습니다: 개발 도구.
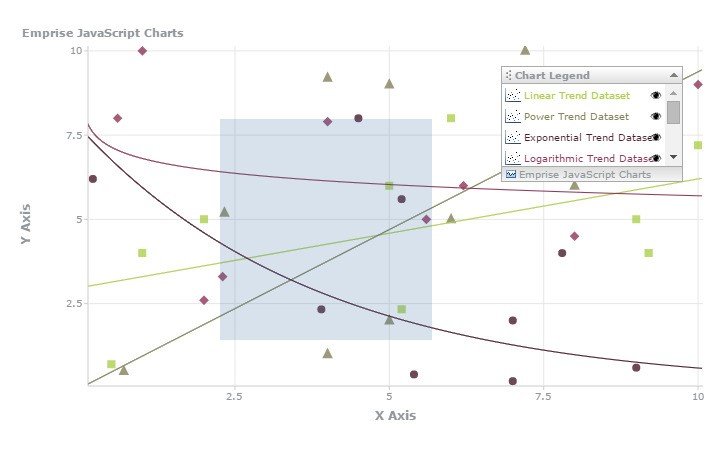
With genuine ease of use and complete customization Emprise JavaScript Charts provides you with the tools you need to publish your data quickly and in a variety of formats. With its wide range of interactive features, simple and straightforward implementation, and unparalleled functionality, Emprise JavaScript Charts is the clear first choice for all your charting needs.
풍모
- Interactive: Features such as Hints, Mouse Tracking, Mouse Events, Key Tracking and Events, Zooming, Scrolling, and Crosshairs raise interactivity and user experience in web charting to a new level.
- Axis Scaling: There's no need to determine your data range before hand. EJSChart will calculate and scale automatically to fit whatever data it is presented with.
- Auto Zooming, Scrolling: Too much data and not enough screen real estate? Show it all. Let your end users zoom in on the pieces they're most interested in. Axis locking for single axis zoom, scrolling and automatic axis scaling are all included.
- Stackable Series: Multiple chart series can be stacked and combined to fit many charting needs.
- Multiple Series Types: Line, Area, Scatter, Pie, Bar and Function series are just the beginning. New series are just a few lines of JavaScript code away.
- Ajax-Driven Data: EJSChart supports XML-formatted data and loads data on the fly. New series can be added and data updated in real time without page reloads.
- Compatible: Built with compatibility in mind and tested on all major browsers, you can be assured your charts will function consistently for the broadest range of end users. See the full list of compatible browsers on our System Requirements page.
- Plugin Free: 100% Pure JavaScript Charting Solution. No more worries of incompatible plugin versions or confusing security warnings. EJSChart is pure JavaScript and requires no client installation.
소프트웨어에 대한 의견을 공유하고 리뷰를 남겨 더 나아지도록 도와주세요!
변경 제안
귀하의 의견
Your vote has been counted.
Do you have experience using this software?
