We've compiled a list of 32 free and paid alternatives to KeyLines Graph Visualization Toolkit. The primary competitors include Graphviz, Gephi. In addition to these, users also draw comparisons between KeyLines Graph Visualization Toolkit and Diagrammix, Grapholite, Polinode. Also you can look at other similar options here: Development Tools.
We've compiled a list of 32 free and paid alternatives to KeyLines Graph Visualization Toolkit. The primary competitors include Graphviz, Gephi. In addition to these, users also draw comparisons between KeyLines Graph Visualization Toolkit and Diagrammix, Grapholite, Polinode. Also you can look at other similar options here: Development Tools.
KeyLines is a JavaScript toolkit for building high-performance graph visualization applications...
KeyLines is a JavaScript toolkit for building high-performance graph visualization applications...
KeyLines Graph Visualization Toolkit Platforms
iPad
iPhone
Linux
Mac
Android
Web-Based
Windows
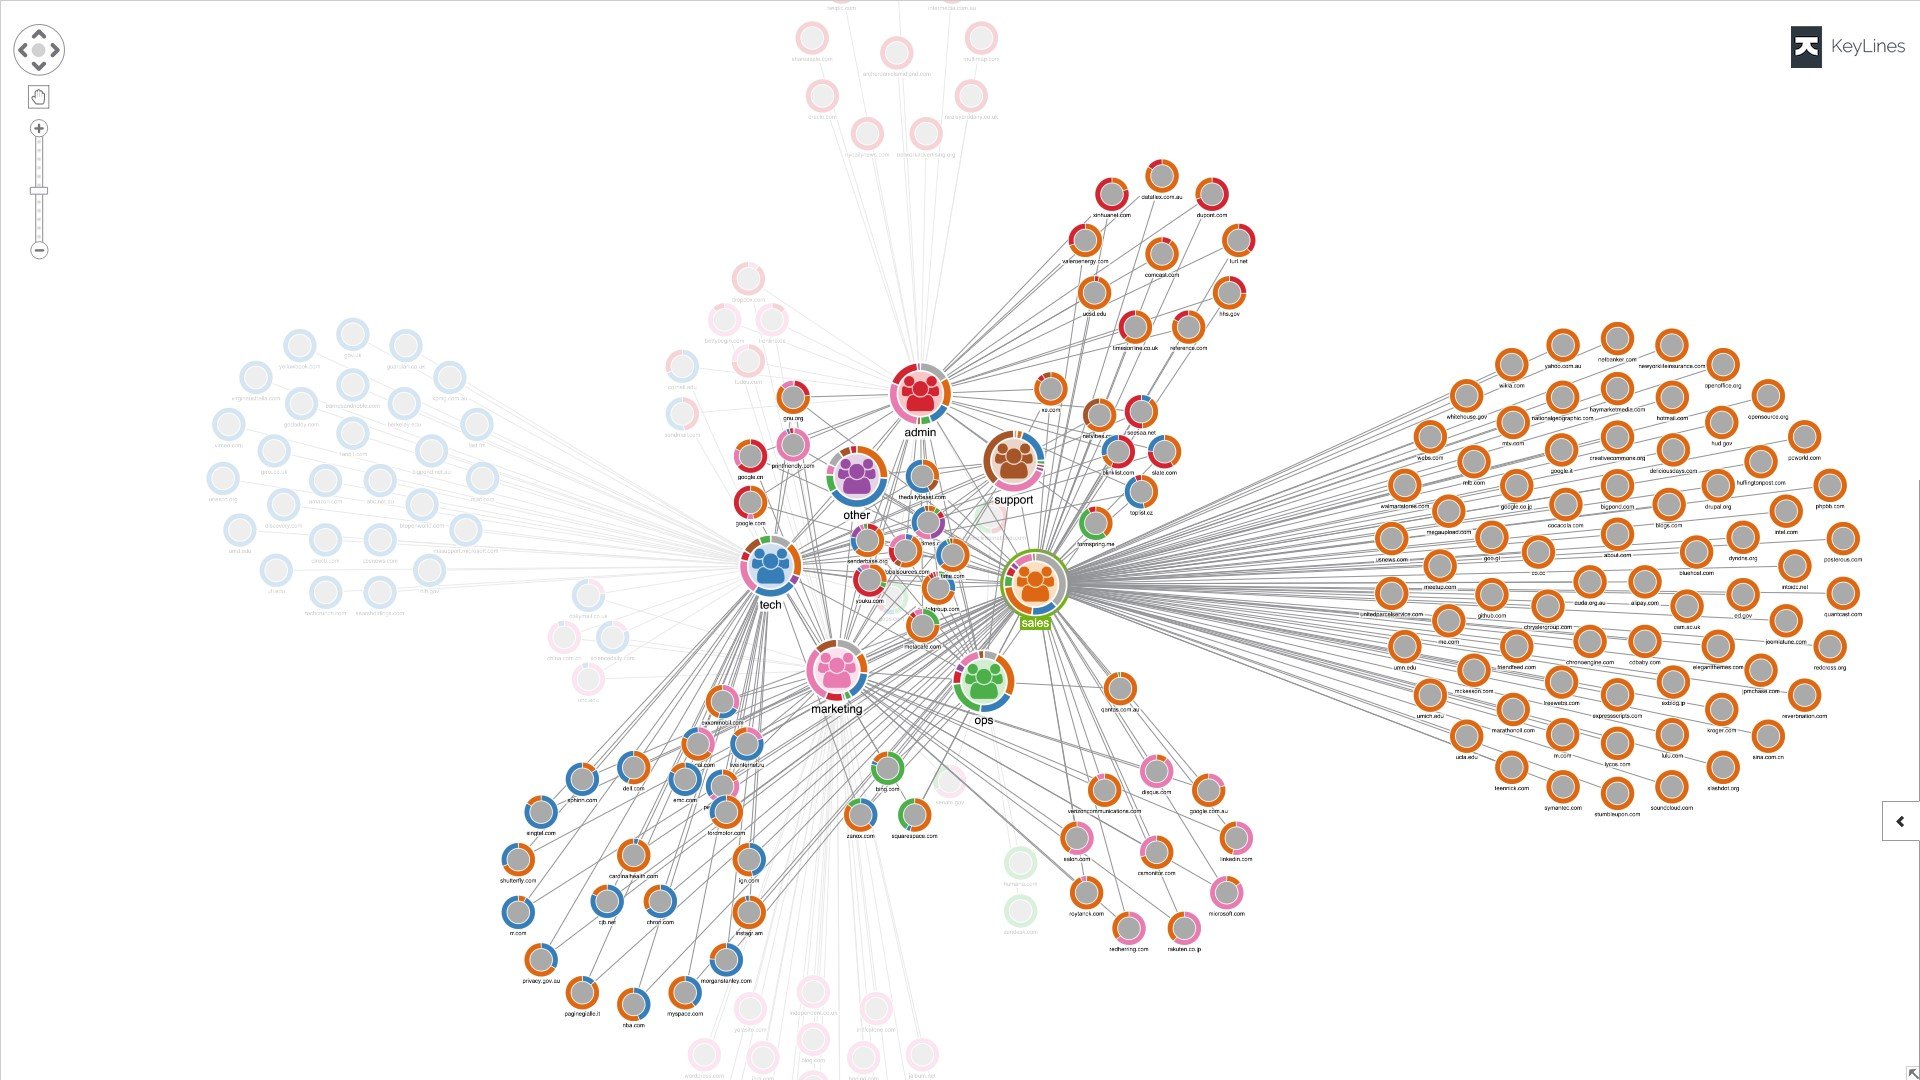
KeyLines Graph Visualization Toolkit Video and Screenshots
KeyLines Graph Visualization Toolkit Overview
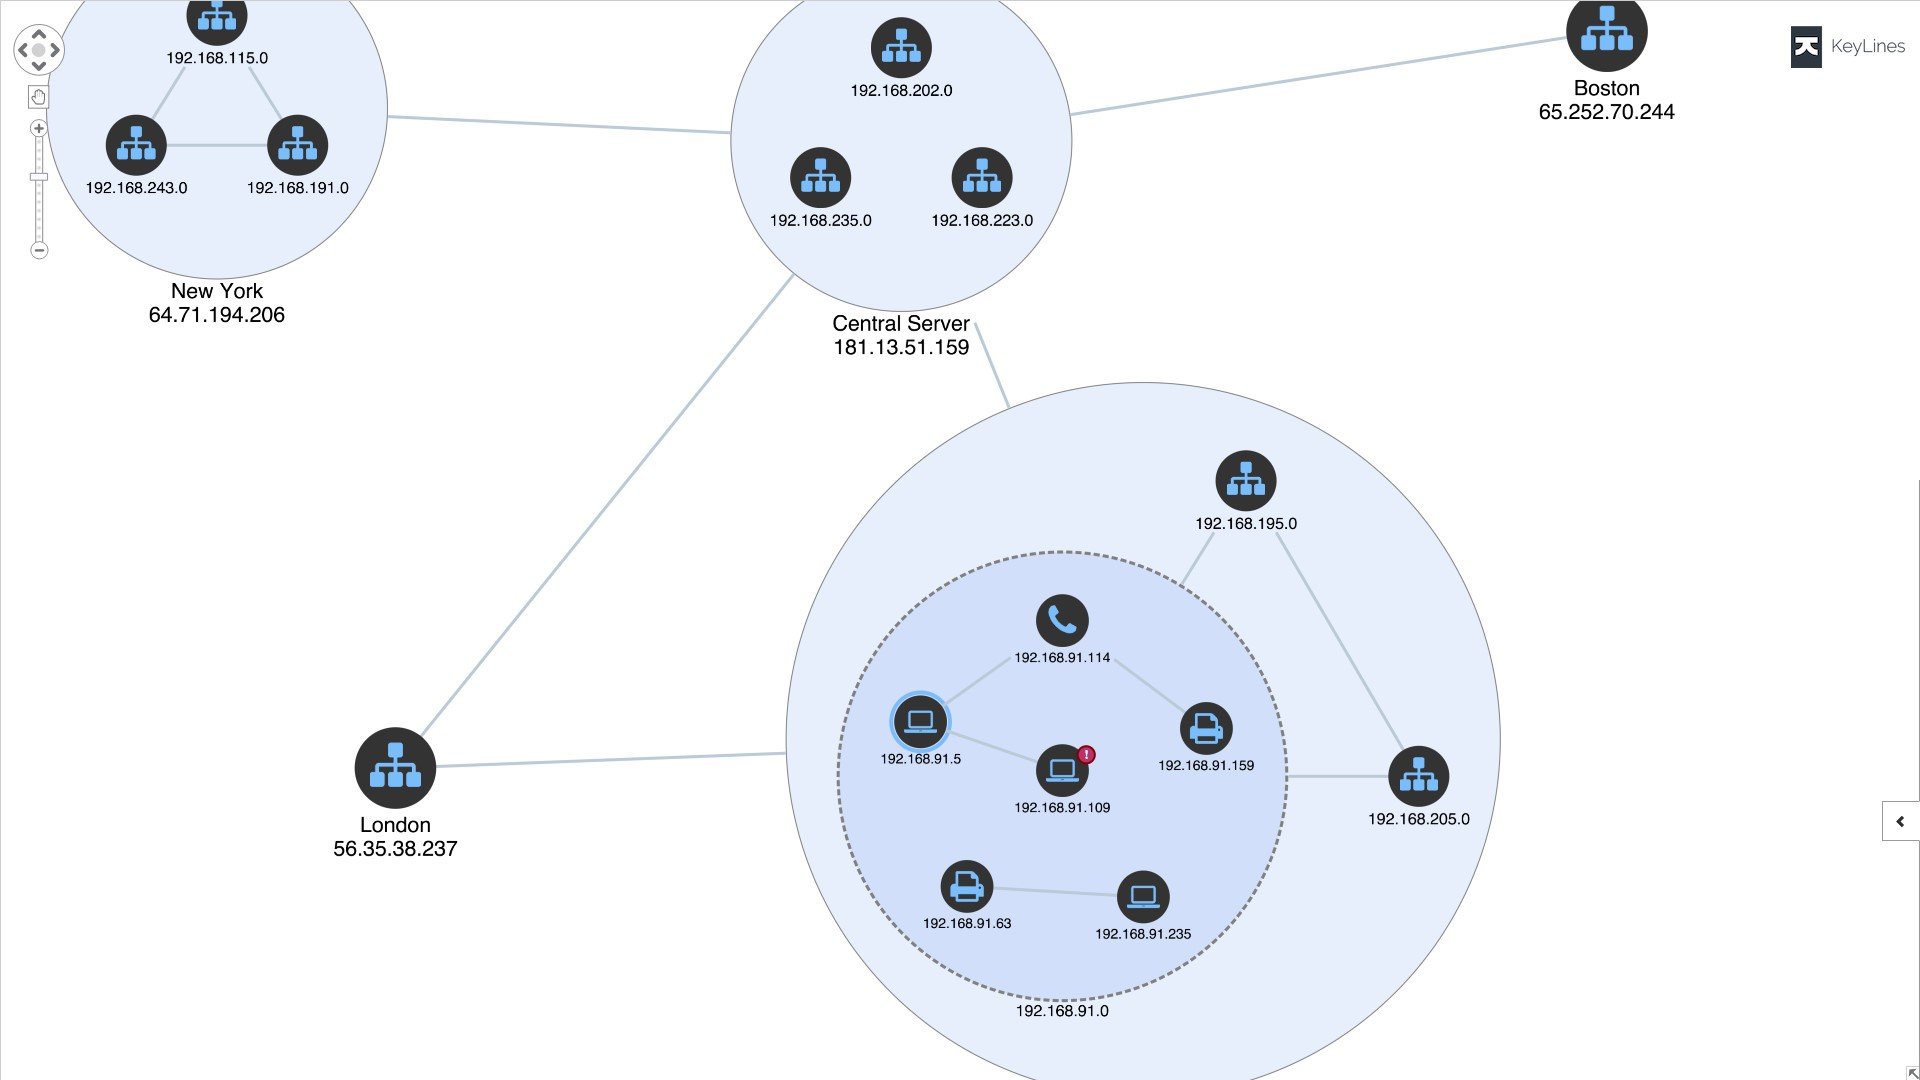
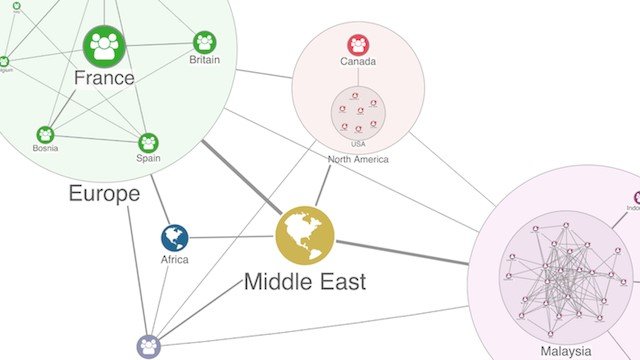
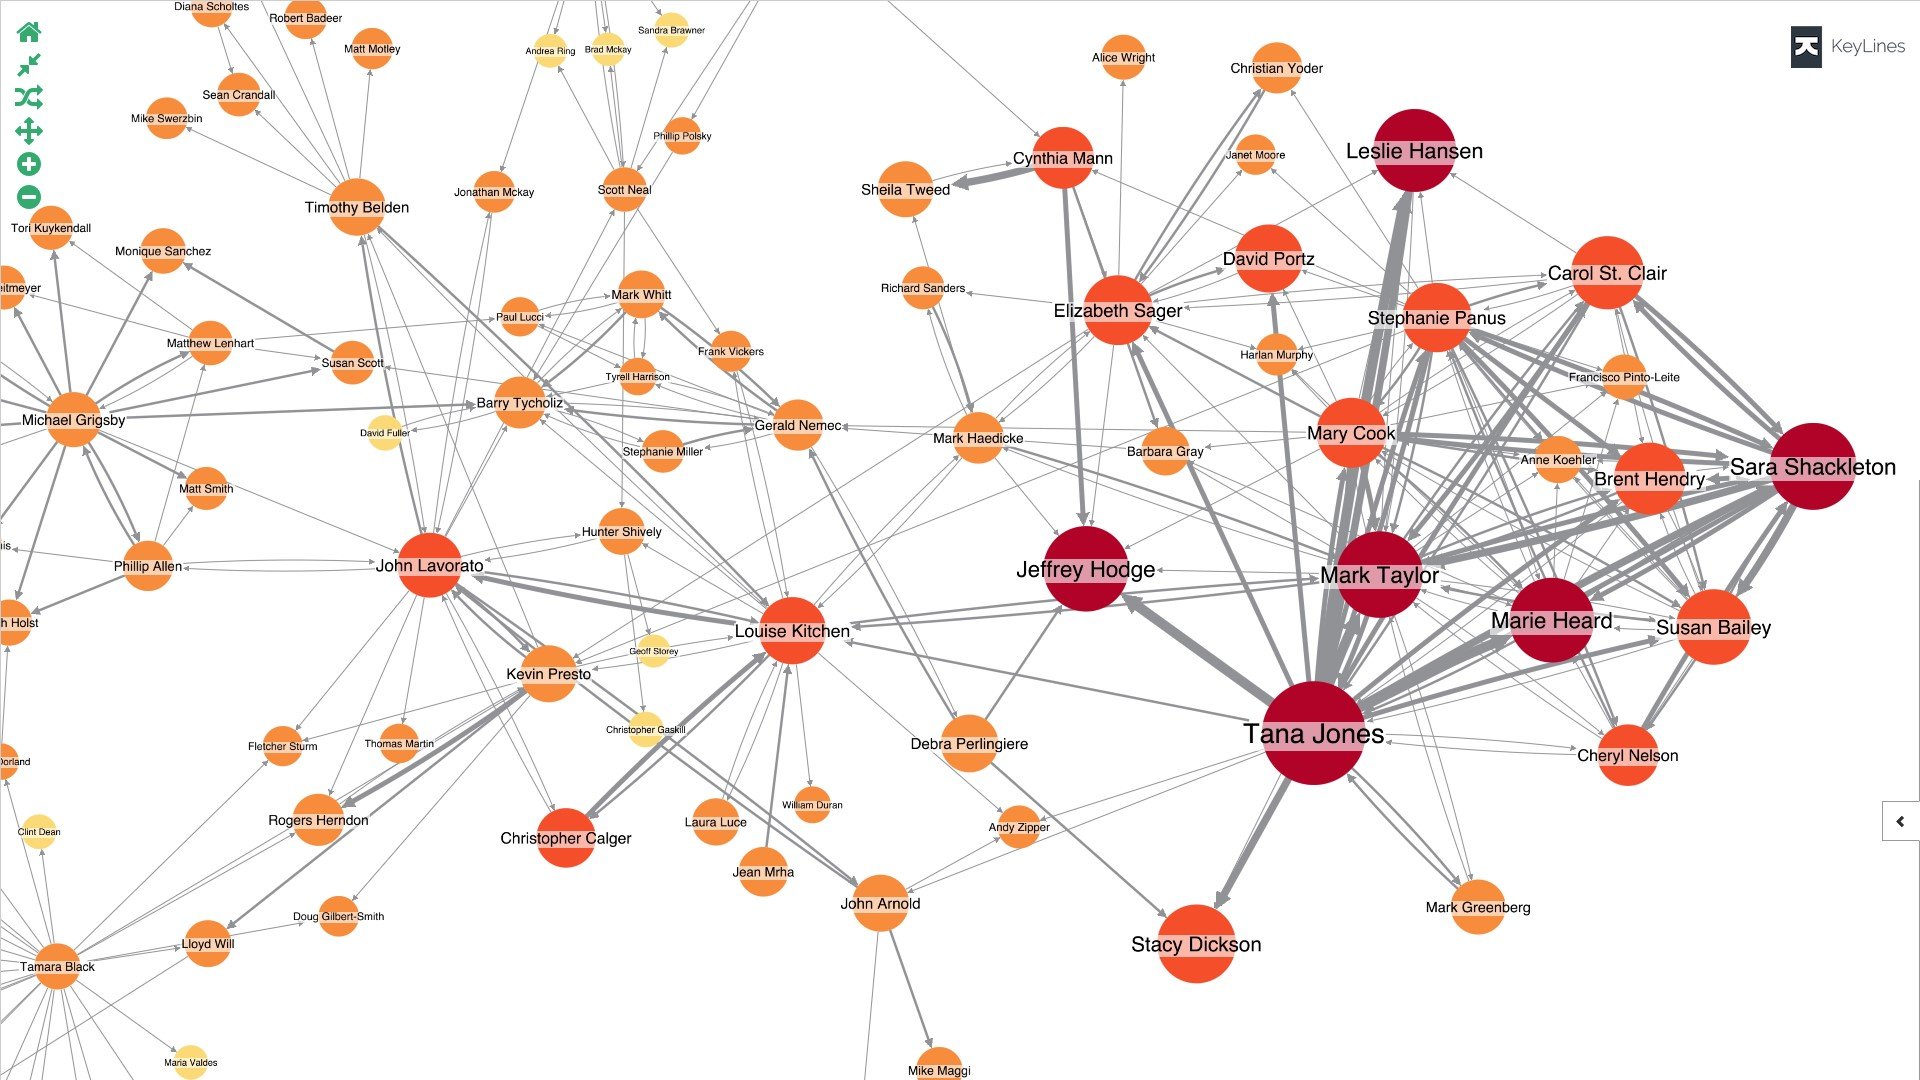
KeyLines is a JavaScript toolkit used by developers to build powerful network visualization applications, quickly.
These applications run run completely in a web browser, making them easy to integrate into existing systems and dashboards, or as standalone tools. They are also highly interactive, with rich analytical functionality including:
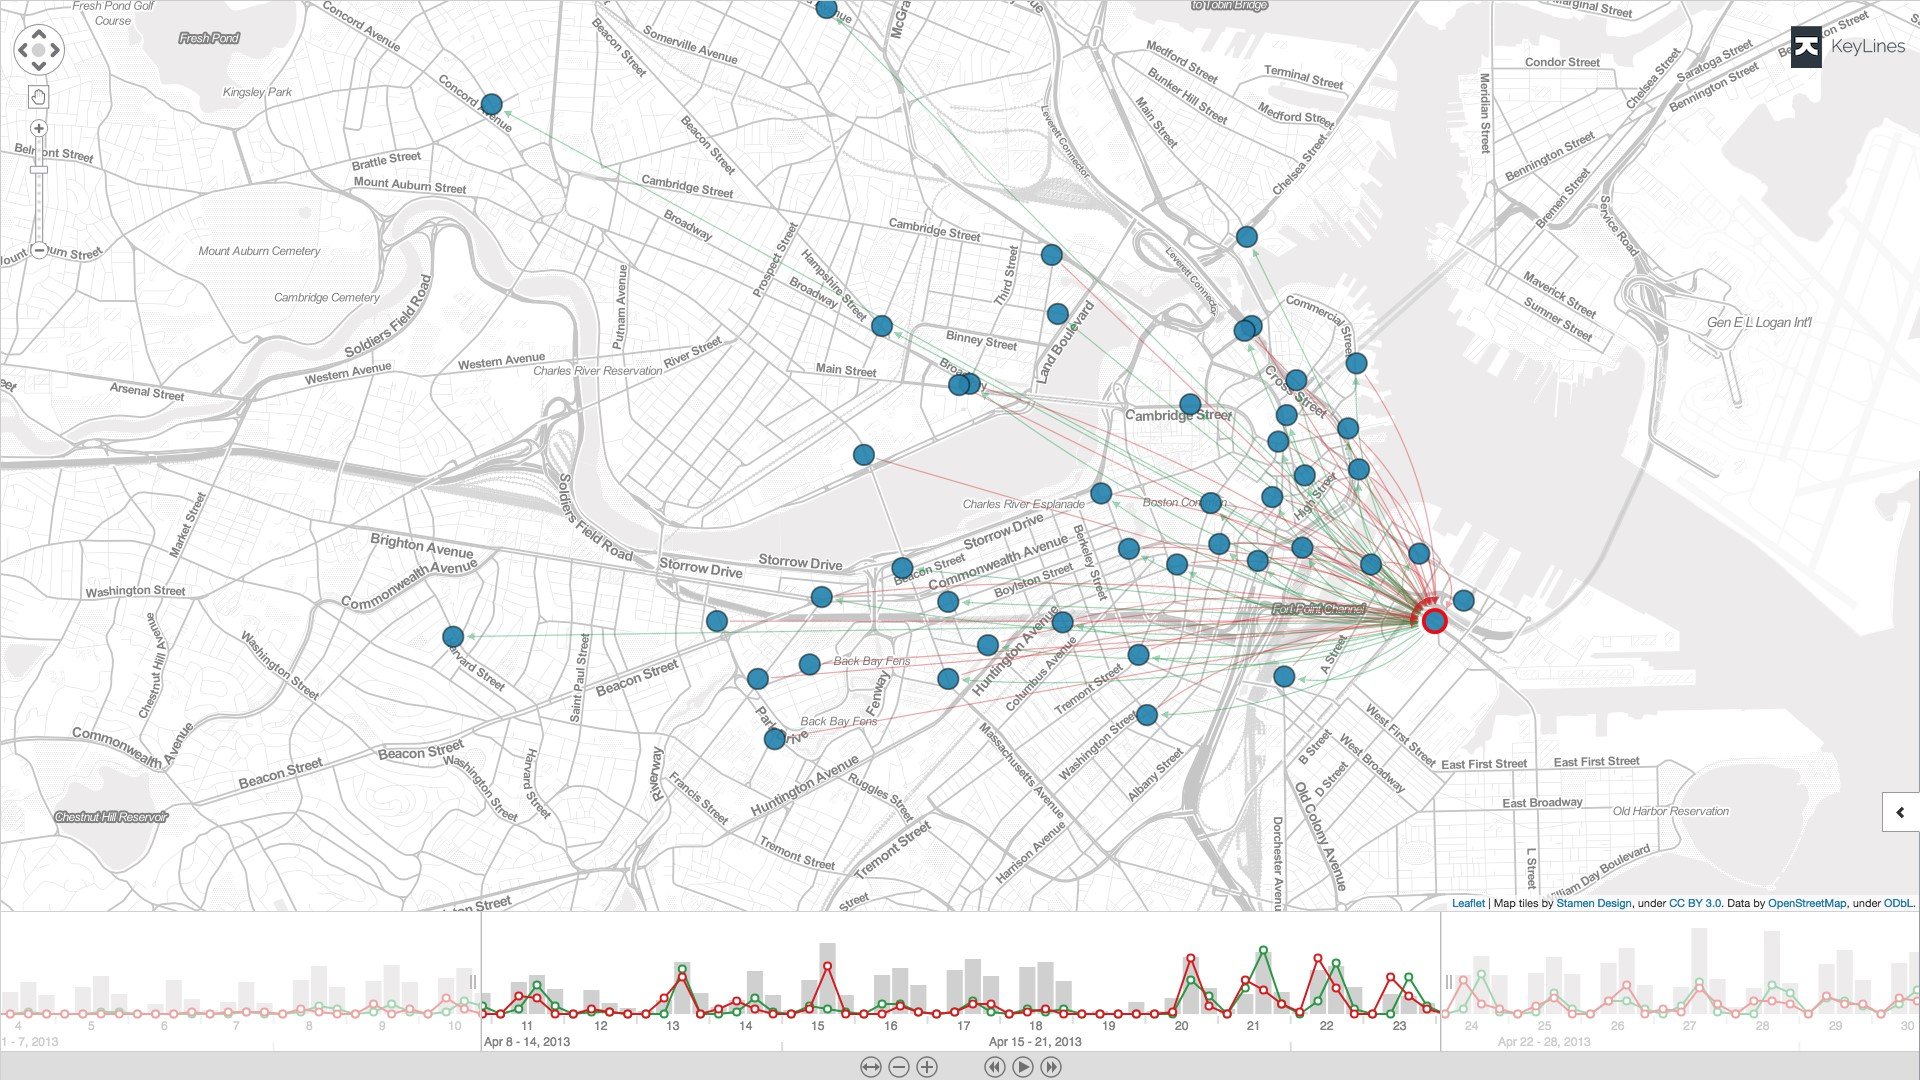
- Automatic graph layouts - Social network analysis measures - Graph filtering - Dynamic graph support - Geospatial graph visualization - WebGL and HTML5 canvas graphics rendering
KeyLines Graph Visualization Toolkit Features
Geospatial analysis
Top KeyLines Graph Visualization Toolkit Alternatives