Select your language

Home arrow-right ... arrow-right Development Software arrow-right Software Development Analytics Tools arrow-right Deleaker

We've compiled a list of 4 free and paid alternatives to Deleaker. The primary competitors include Valgrind, .NET Memory Profiler. In addition to these, users also draw comparisons between Deleaker and AQtime Pro, dotTrace Memory. Also you can look at other similar options here: Development Software, Software Development Analytics Tools.


Valgrind
Free Open Source

Valgrind is an instrumentation framework for building dynamic analysis tools.

.NET Memory Profiler is a powerful tool for finding memory leaks and optimizing the memory usage in...

AQtime is an application performance profiler toolkit, providing application runtime & static...

With dotTrace Memory, you can quickly profile the memory usage of your applications based on .

Deleaker is a standalone application and a useful extension for Visual Studio 2005, 2008, 2010...

Deleaker Video and Screenshots

Deleaker Overview

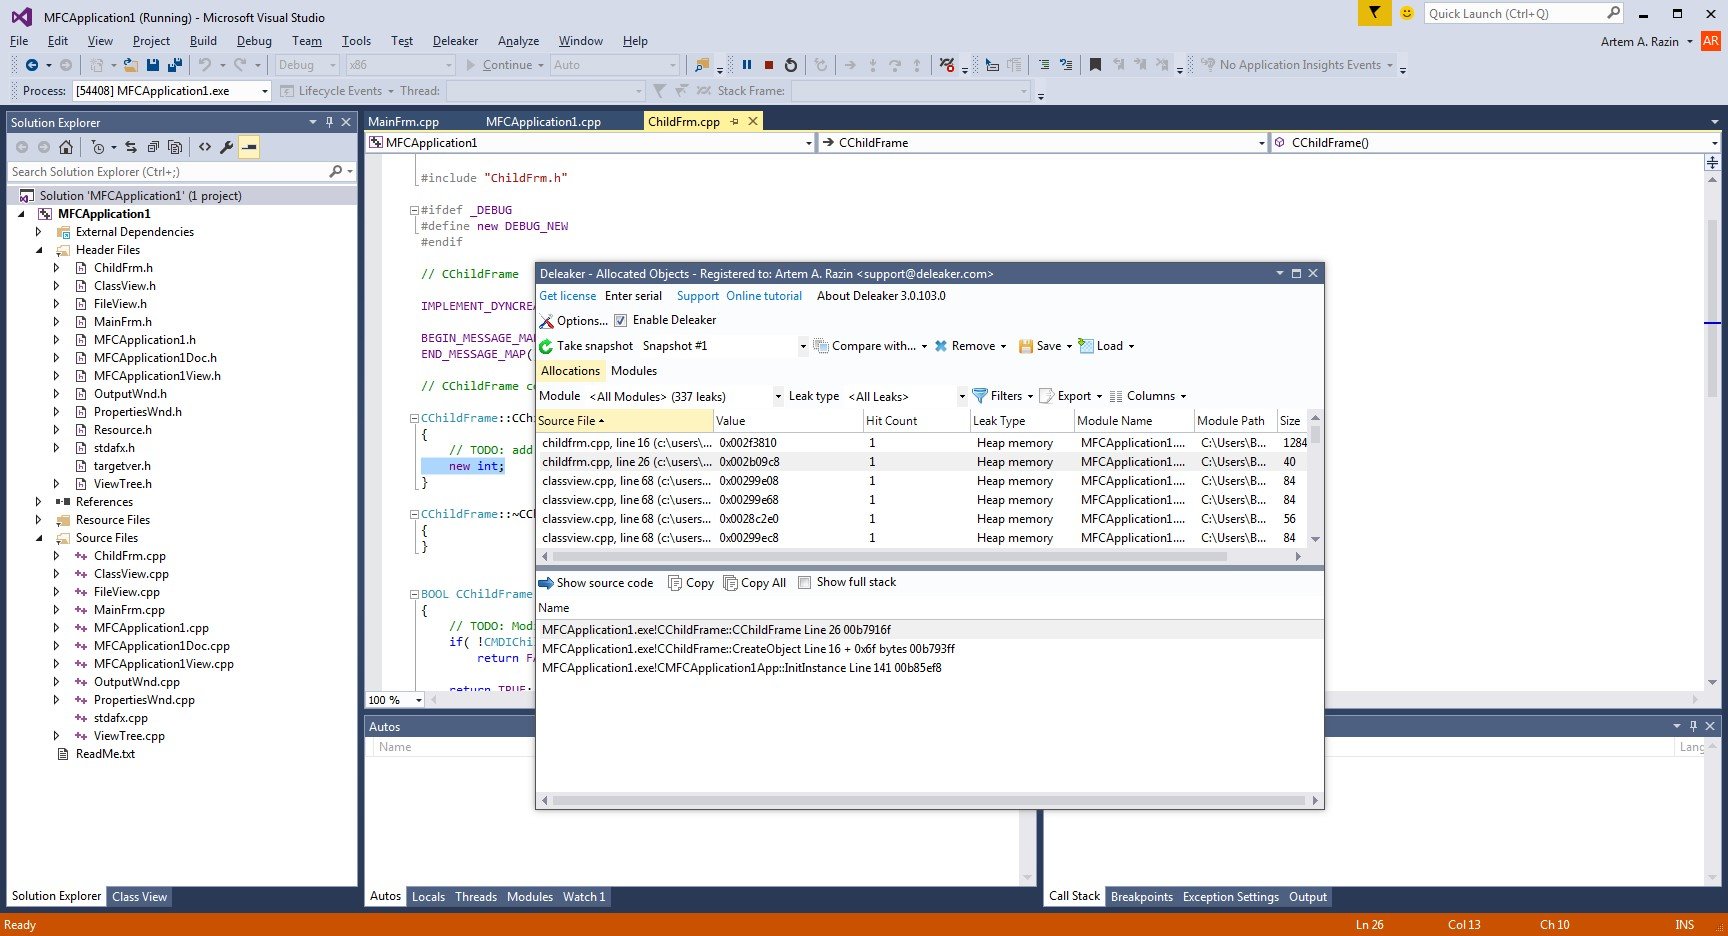
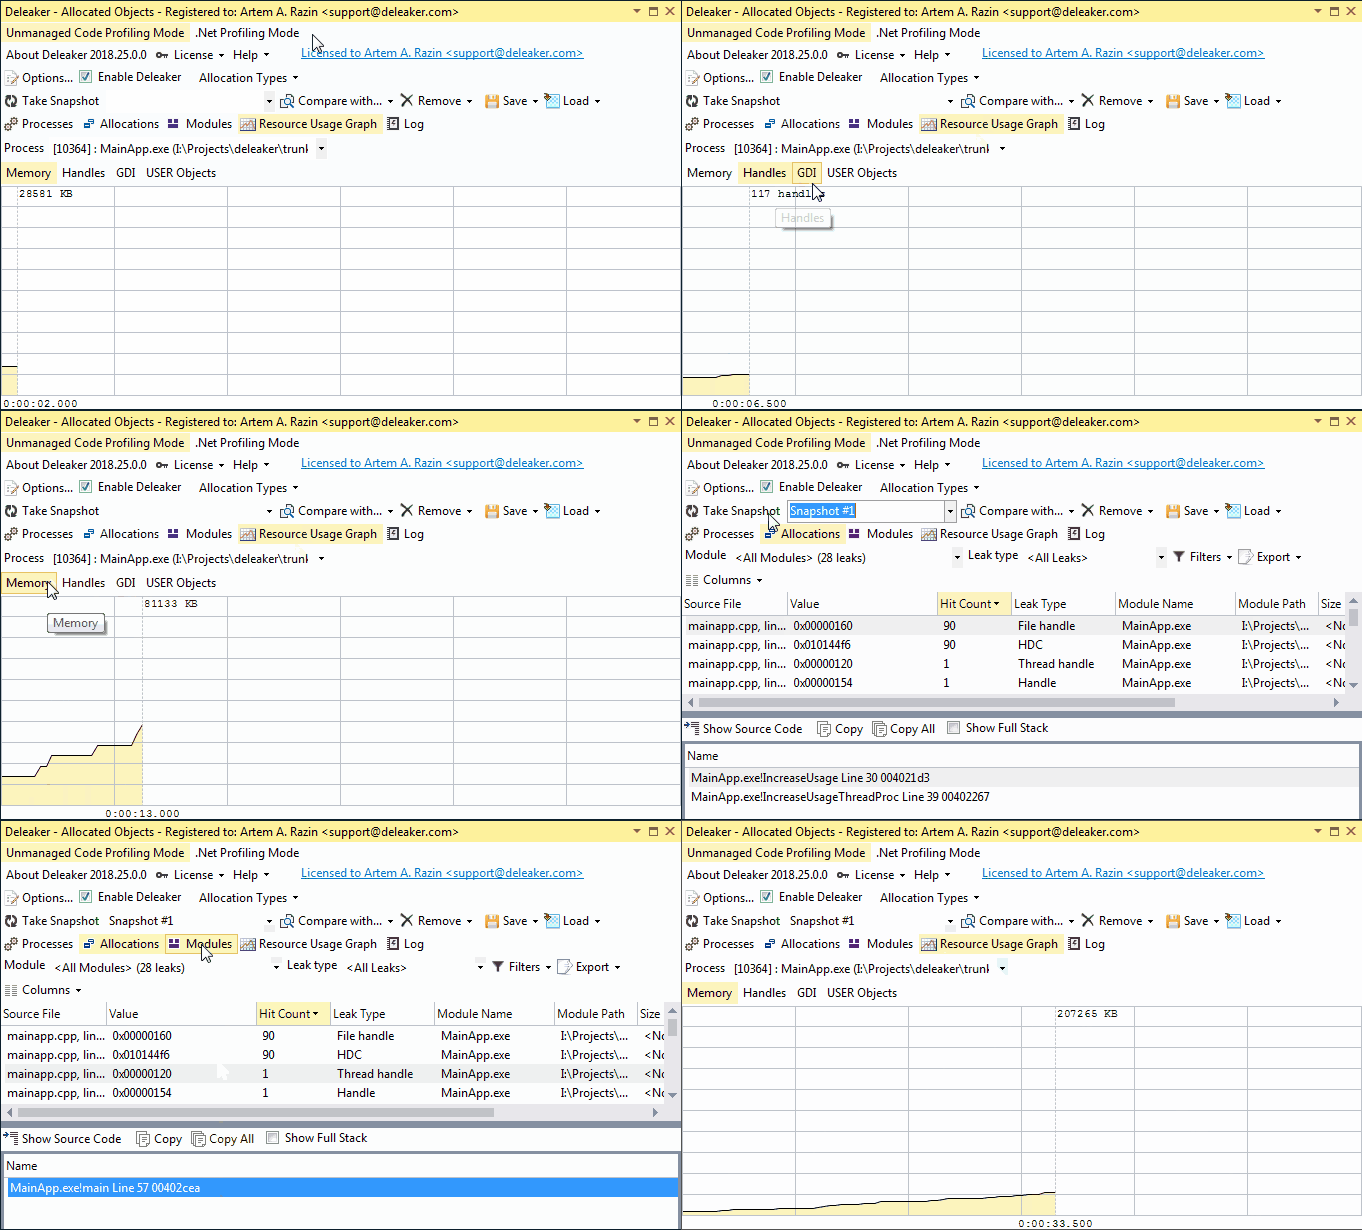
Deleaker is a standalone application and a useful extension for Visual Studio 2005, 2008, 2010, 2012, 2013, 2015, 2017 and 2019, that helps you to analyze programming errors, many of which are unique to Visual C++ and .Net. Deleaker is a great tool for Visual C++ and .Net developers who occasionally have trouble detecting resource leaks and debugging their applications. With Deleaker, you can detect and localize resource leaks in memory, GDI and USER objects, handles, with no appreciable slow down to your application.

Debugging has always been a headache for program developers. As bugs go, some of the most difficult to find are leaks, especially in graphics device interface (GDI) objects and menus. Even a small leak can drown the ship of your system's performance. You cannot afford to miss even a single one.

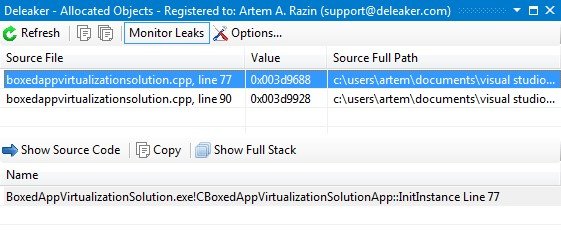
Deleaker is an effective solution to this problem. First, it provides you with information on all GDI objects created while your application is running. For almost all of these objects, you will get a full stack, which helps you to see where exactly in the source code each GDI object was created. A simple double click on the stack entry and the editor will open the file with source code at the corresponding line. Next comes the most important point: when your application exits, Deleaker will provide you with a list of GDI objects that were created but that were not deleted.

Plenty of tools exist to help track down memory leaks, but there are very few good tools to help track GDI resource leaks that can ruin performance on any Windows operating system. And all of them have one major problem, they tremendously slow down the performance of your application. Deleaker is tightly integrated into the Visual Studio development environment and you can be sure that it will not affect the speed of your application. Leaks are possible, even in robust Windows-based applications. Deleaker will find them for you.

Deleaker Platforms

Windows

Top Deleaker Alternatives

Share your opinion about the software, leave a review and help make it even better!

Deleaker Tags

visual-leak-detector resource-leak purify handle-leak gdi-leak eurekalog detect-leaks boundschecker visual-c++ madexcept visual-studio-plugin leak error-detection debugger

Suggest Changes

Your Feedback

Select a rating
Please select a rating

Your vote has been counted.

Do you have experience using this software?