Asana is a comprehensive project management software that enables teams to efficiently manage tasks and projects. Its features include task creation and assignment, priority setting, progress tracking, and file attachment.
IBM Blueworks Live is a cloud-native platform engineered to facilitate collaborative business process design, refinement, and optimization. It features a user-friendly web interface that streamlines process documentation, analysis, and enhancement w…
TIBCO BusinessEvents Enterprise Edition is a real-time event processing platform that extracts, correlates, and analyzes critical business data to identify patterns, trends, and anomalies. It enables automated responses through business rules, enhan…
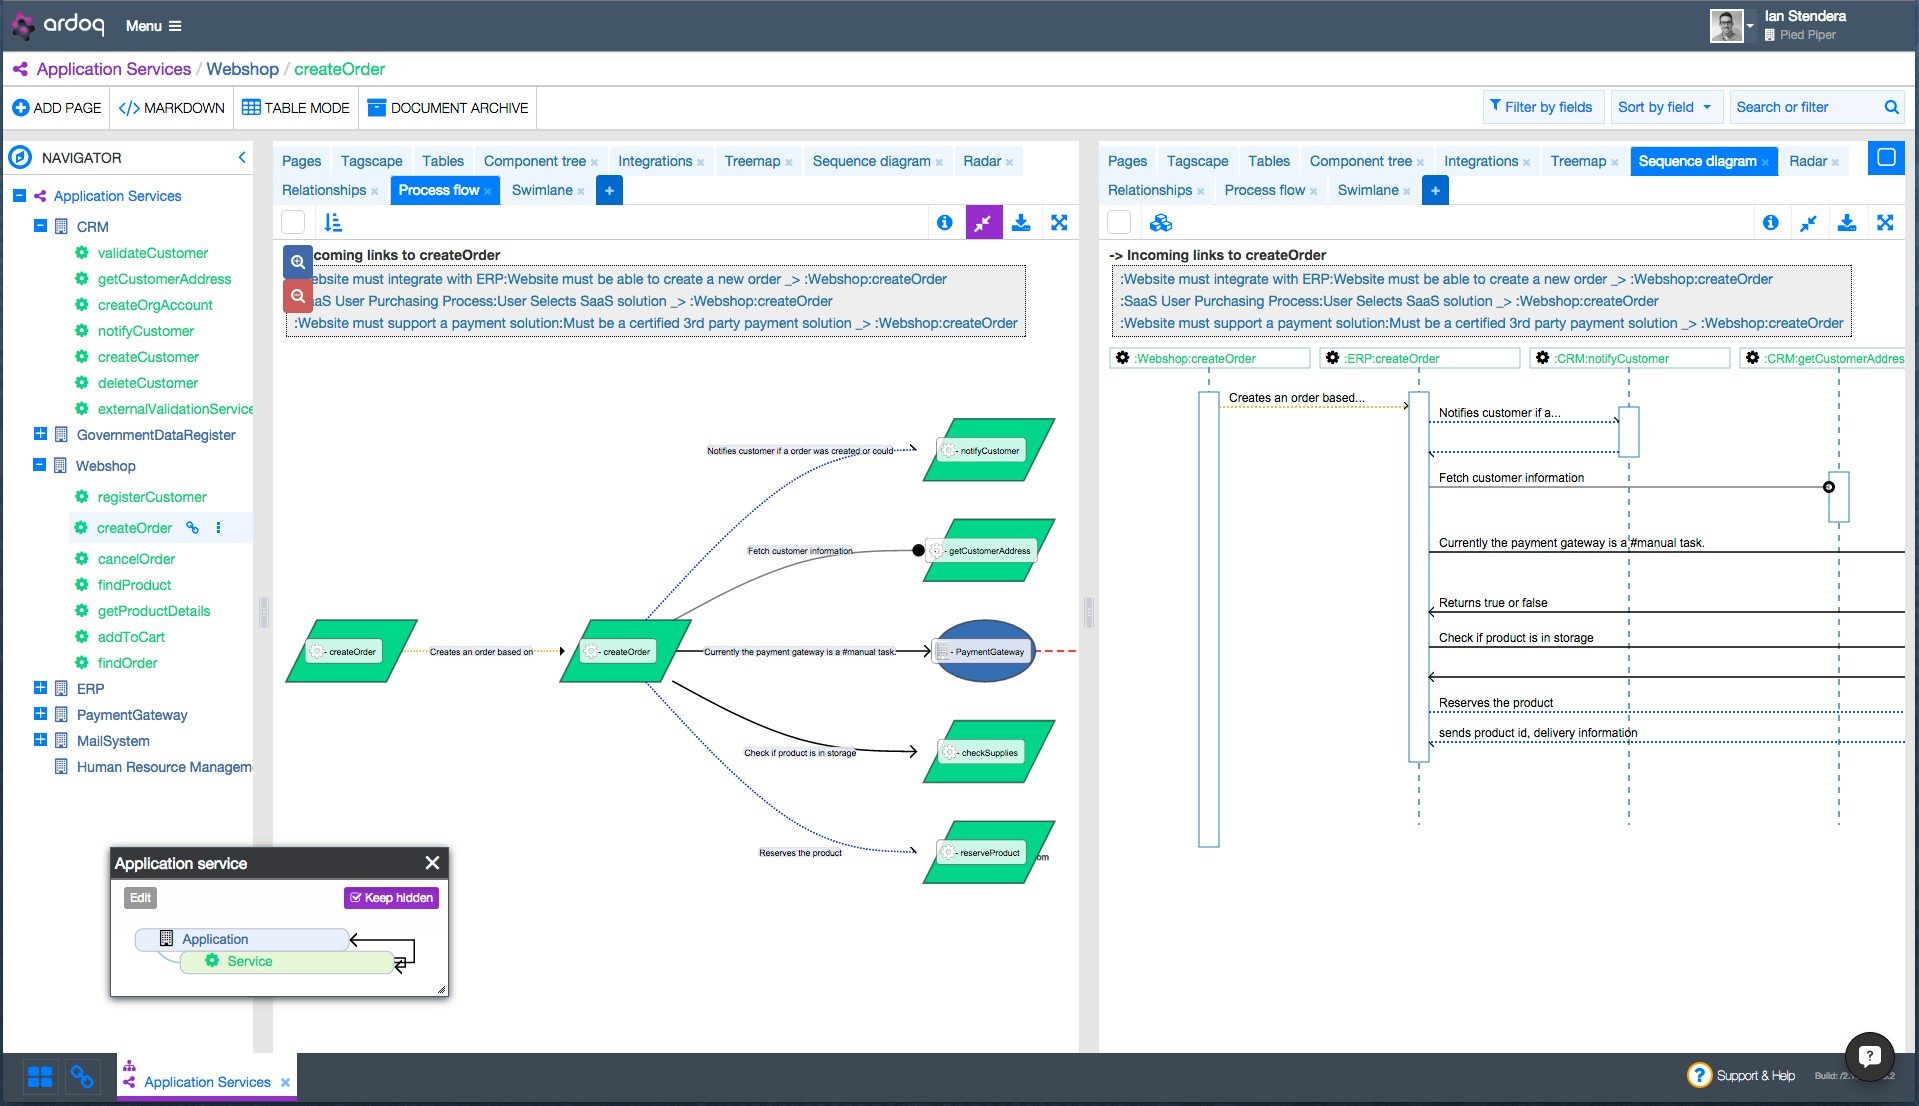
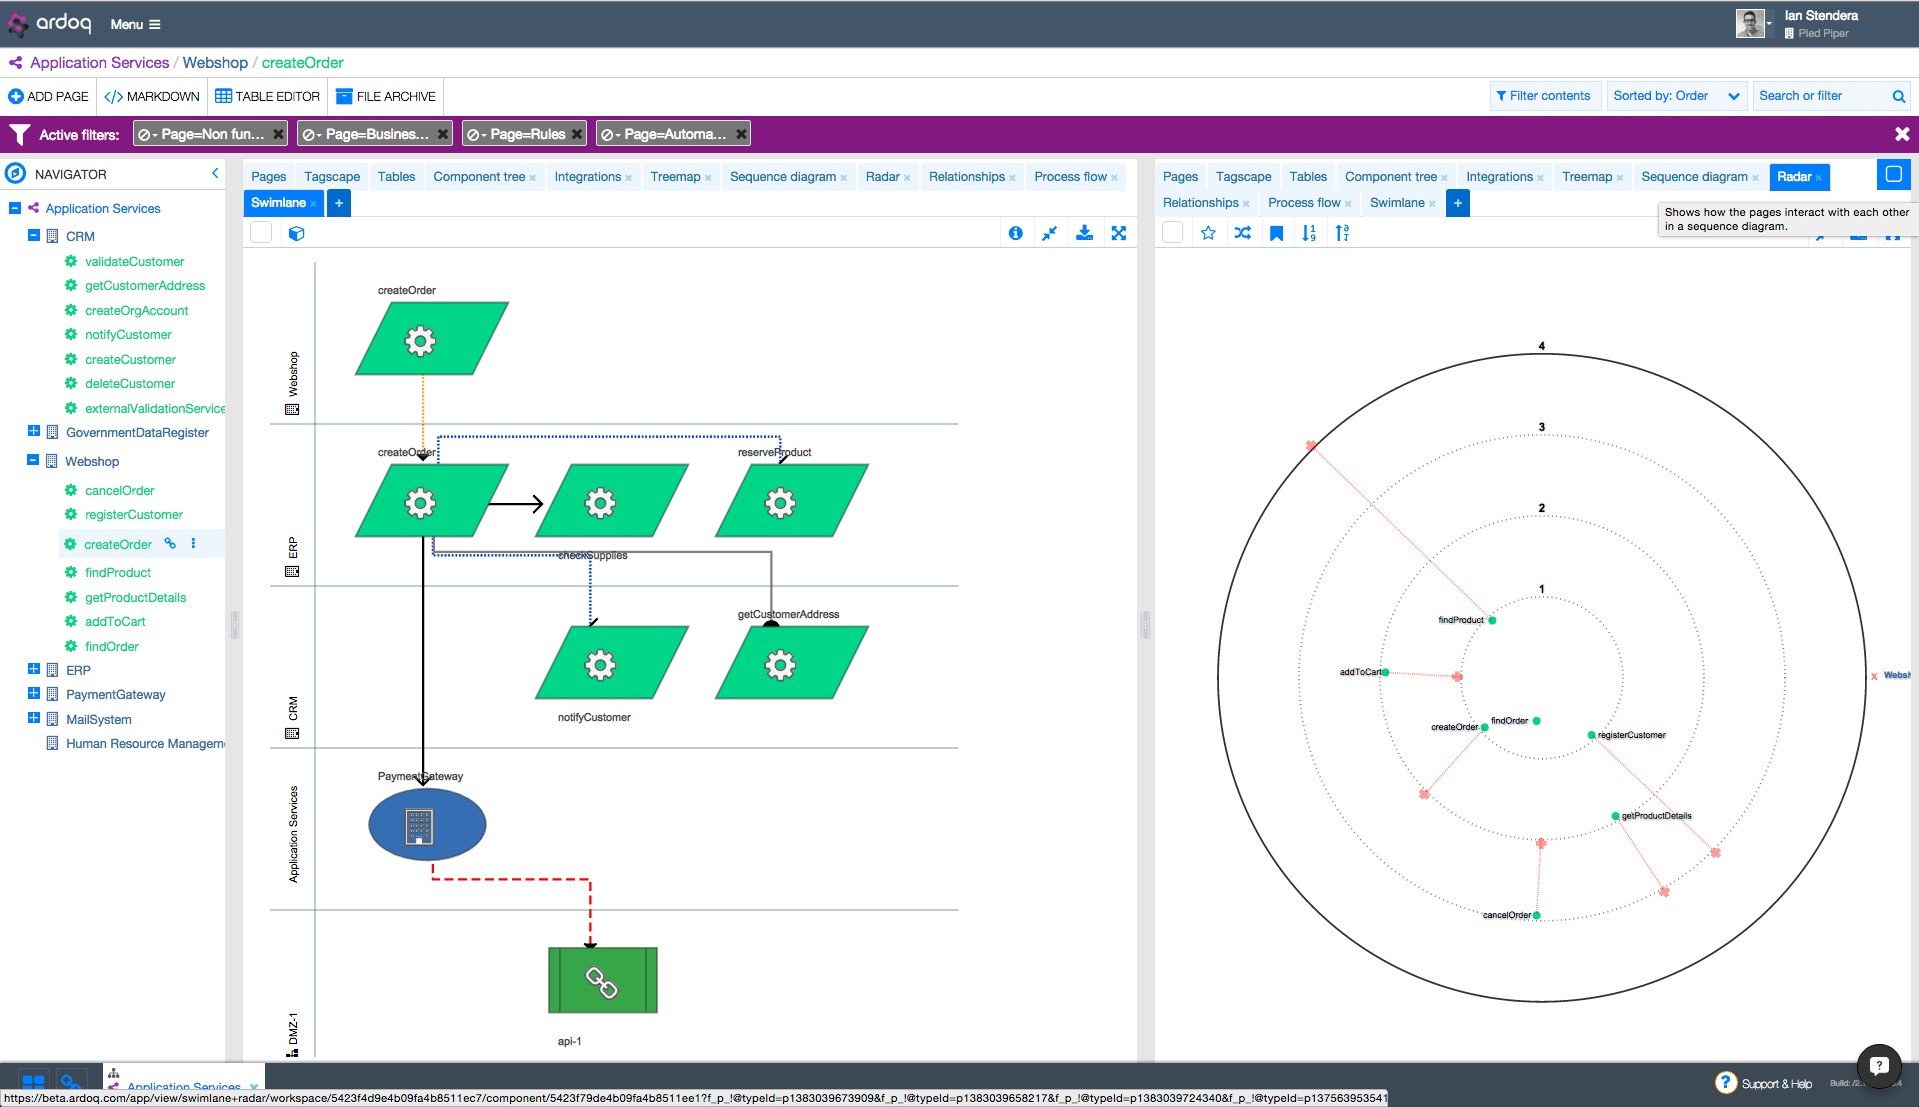
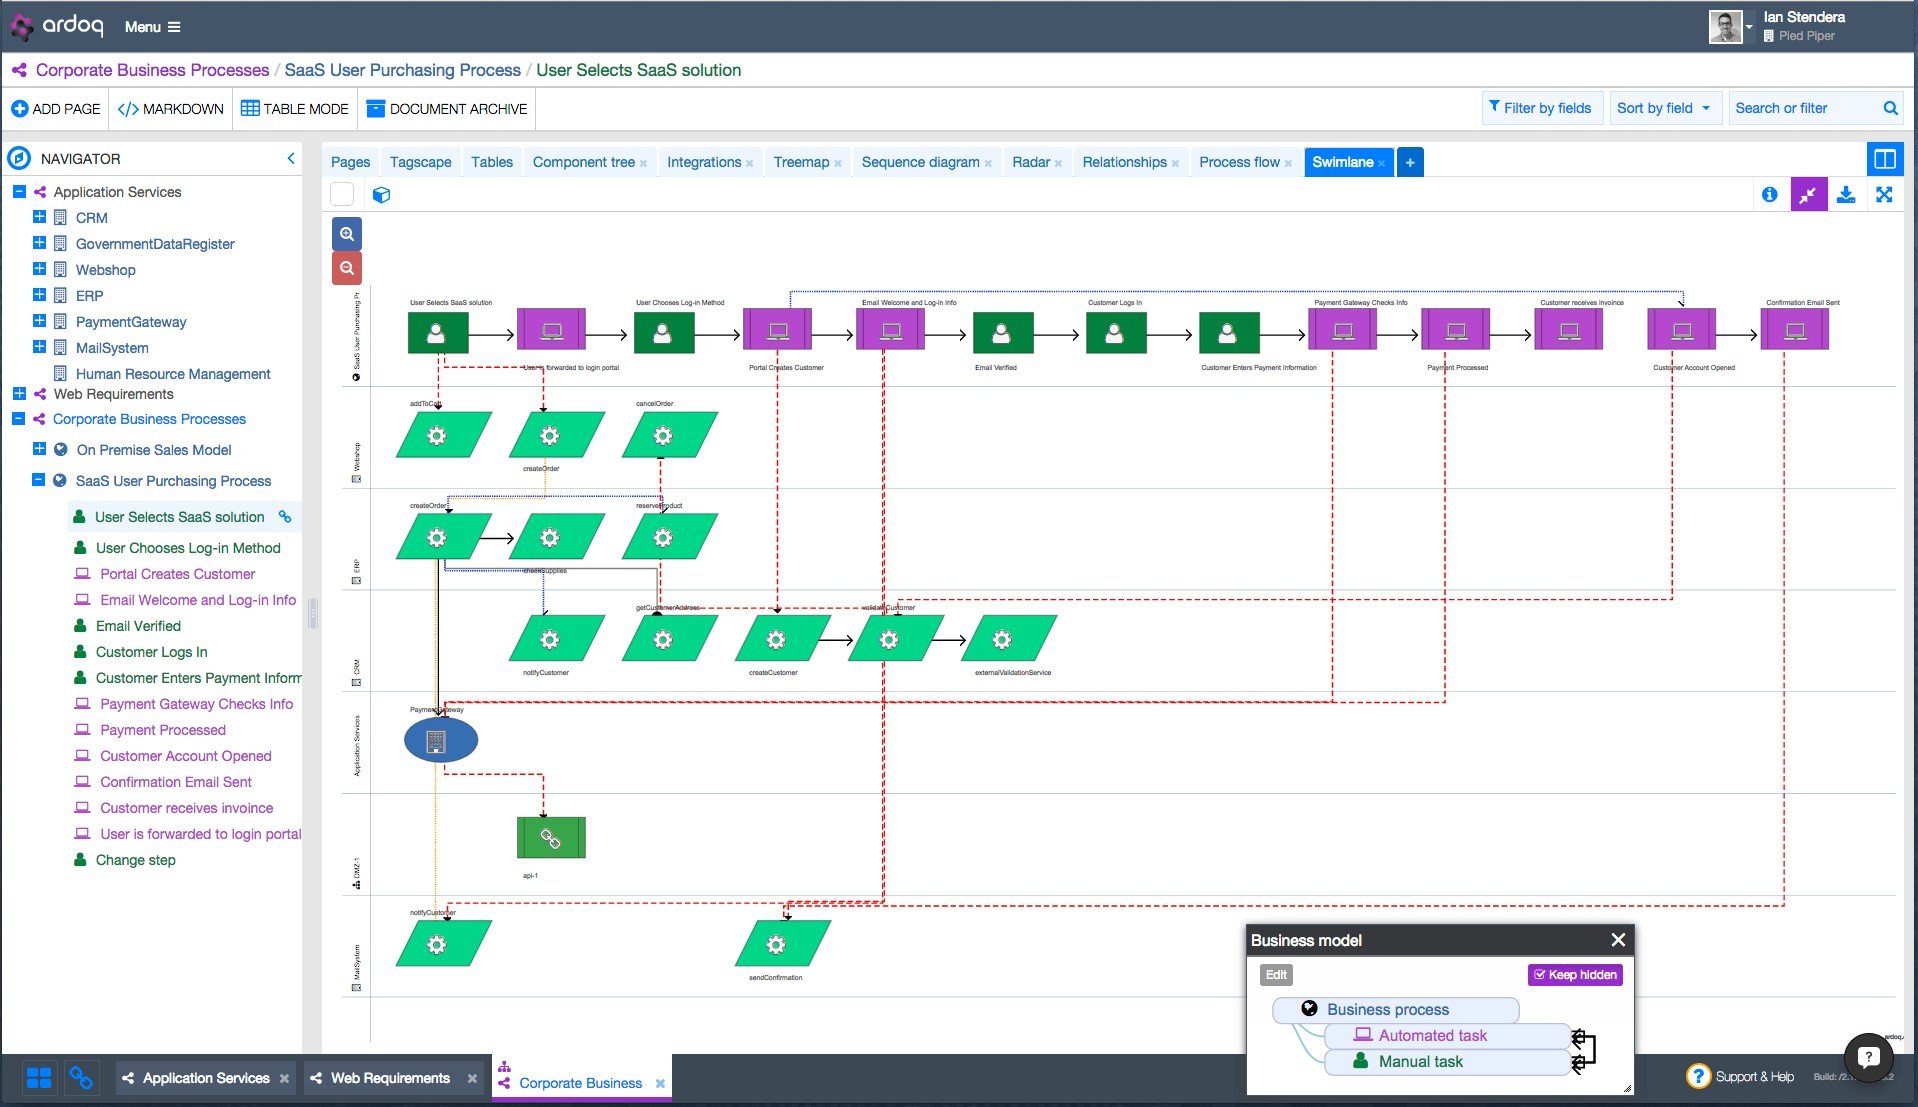
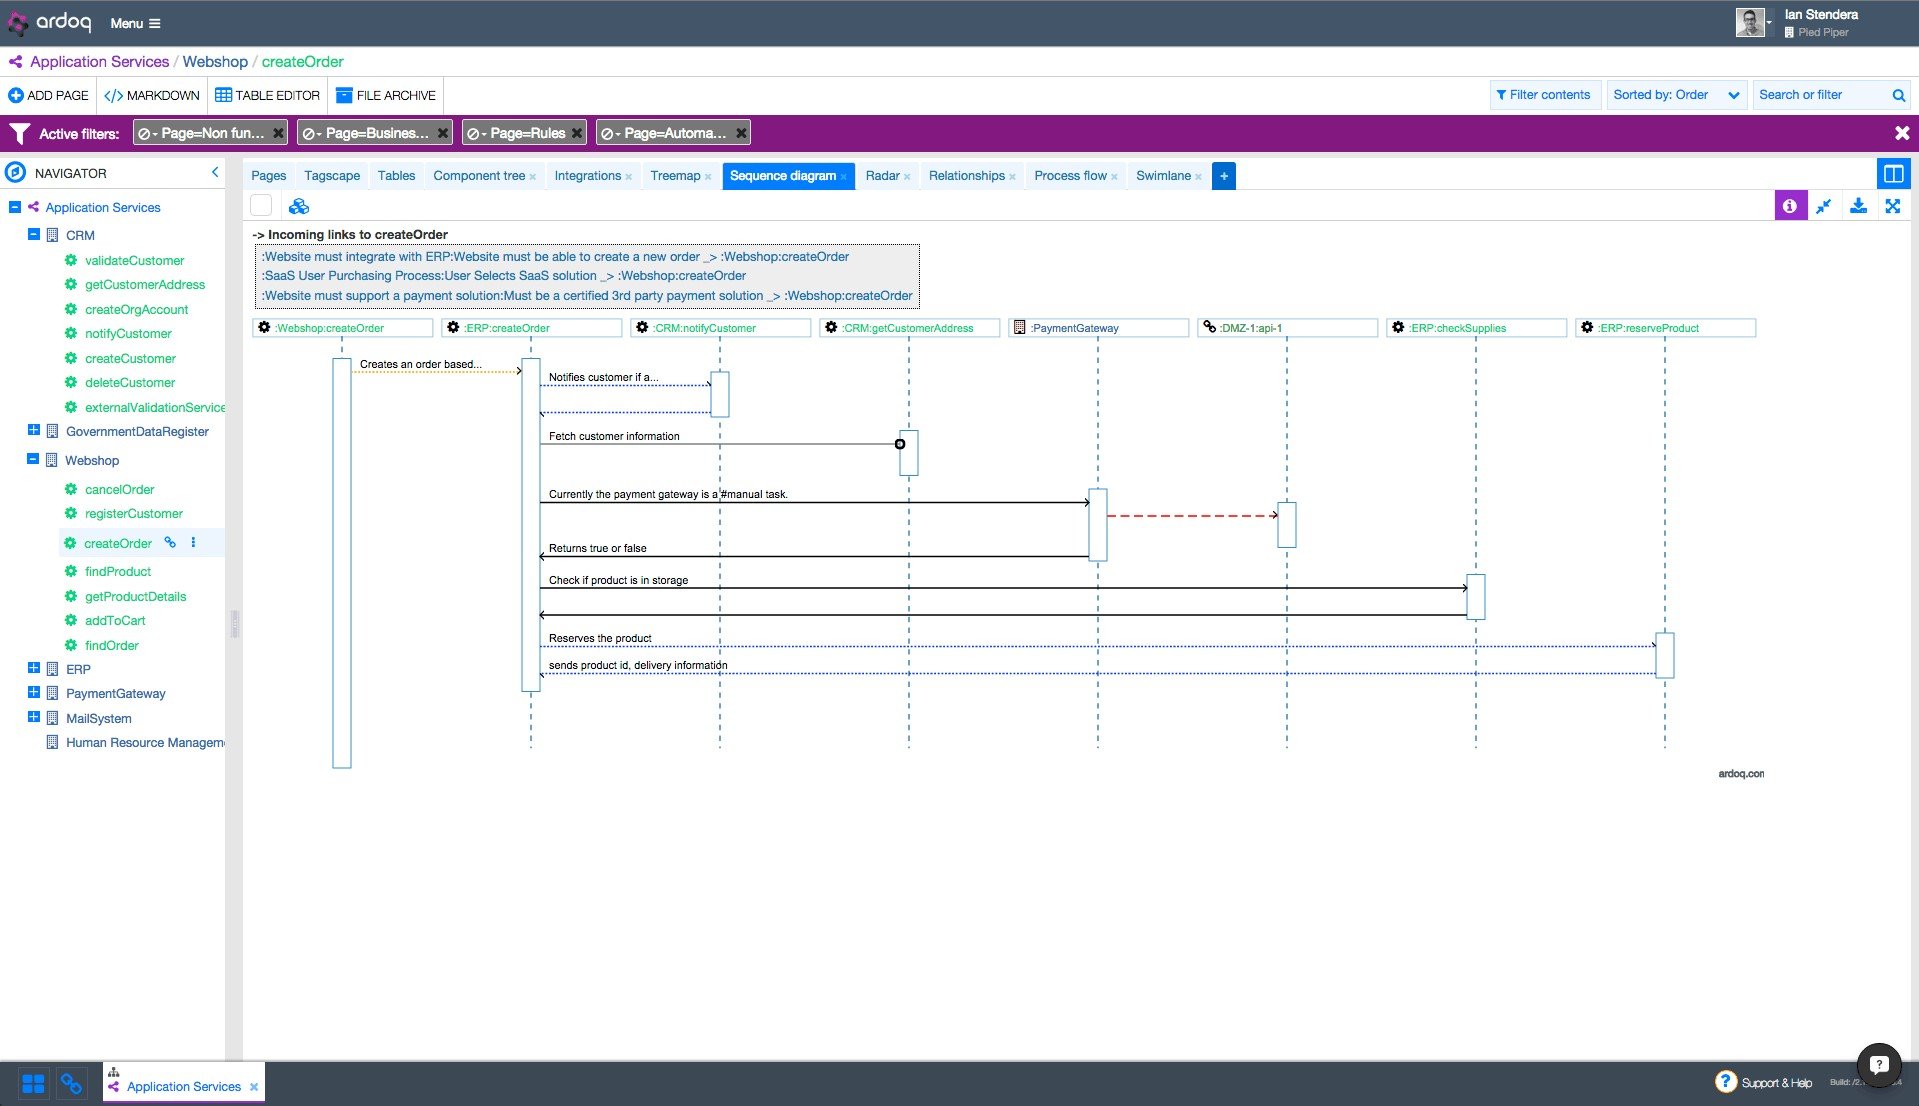
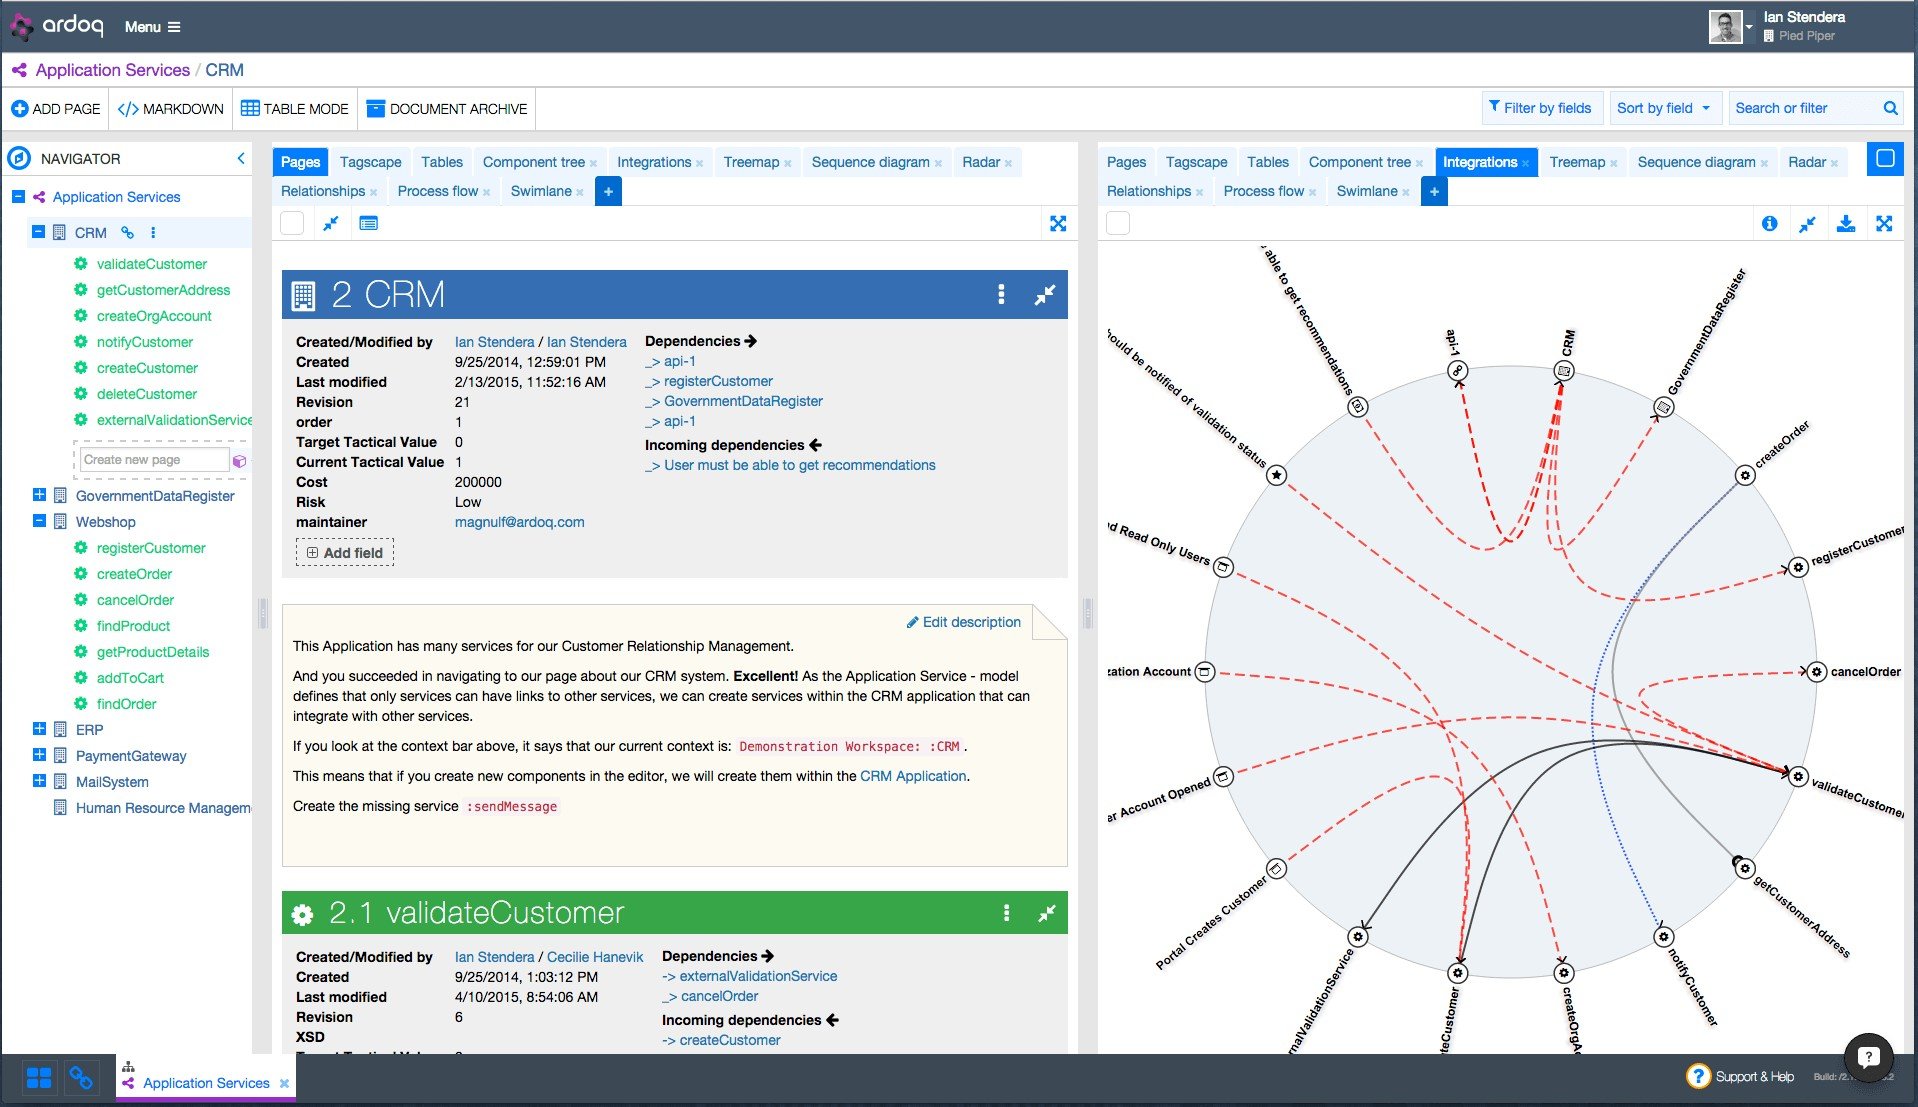
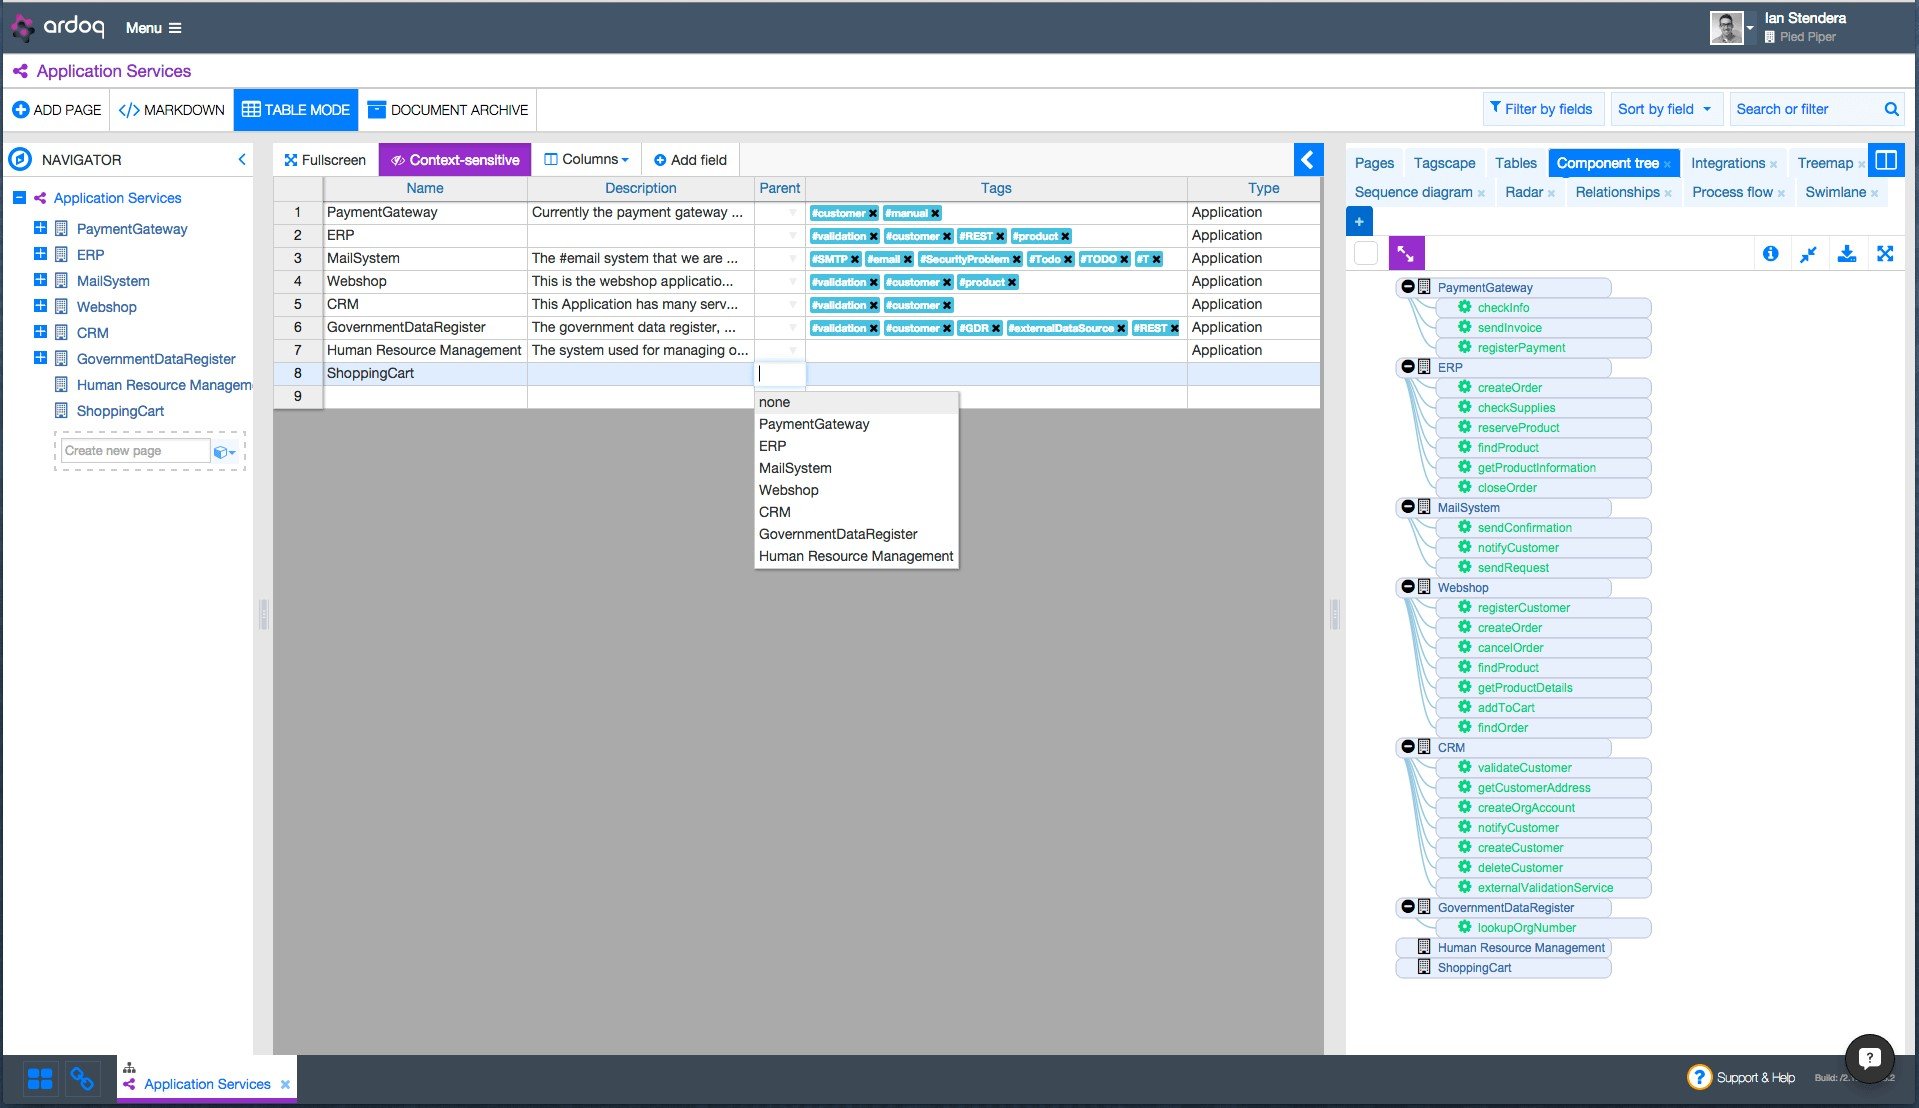
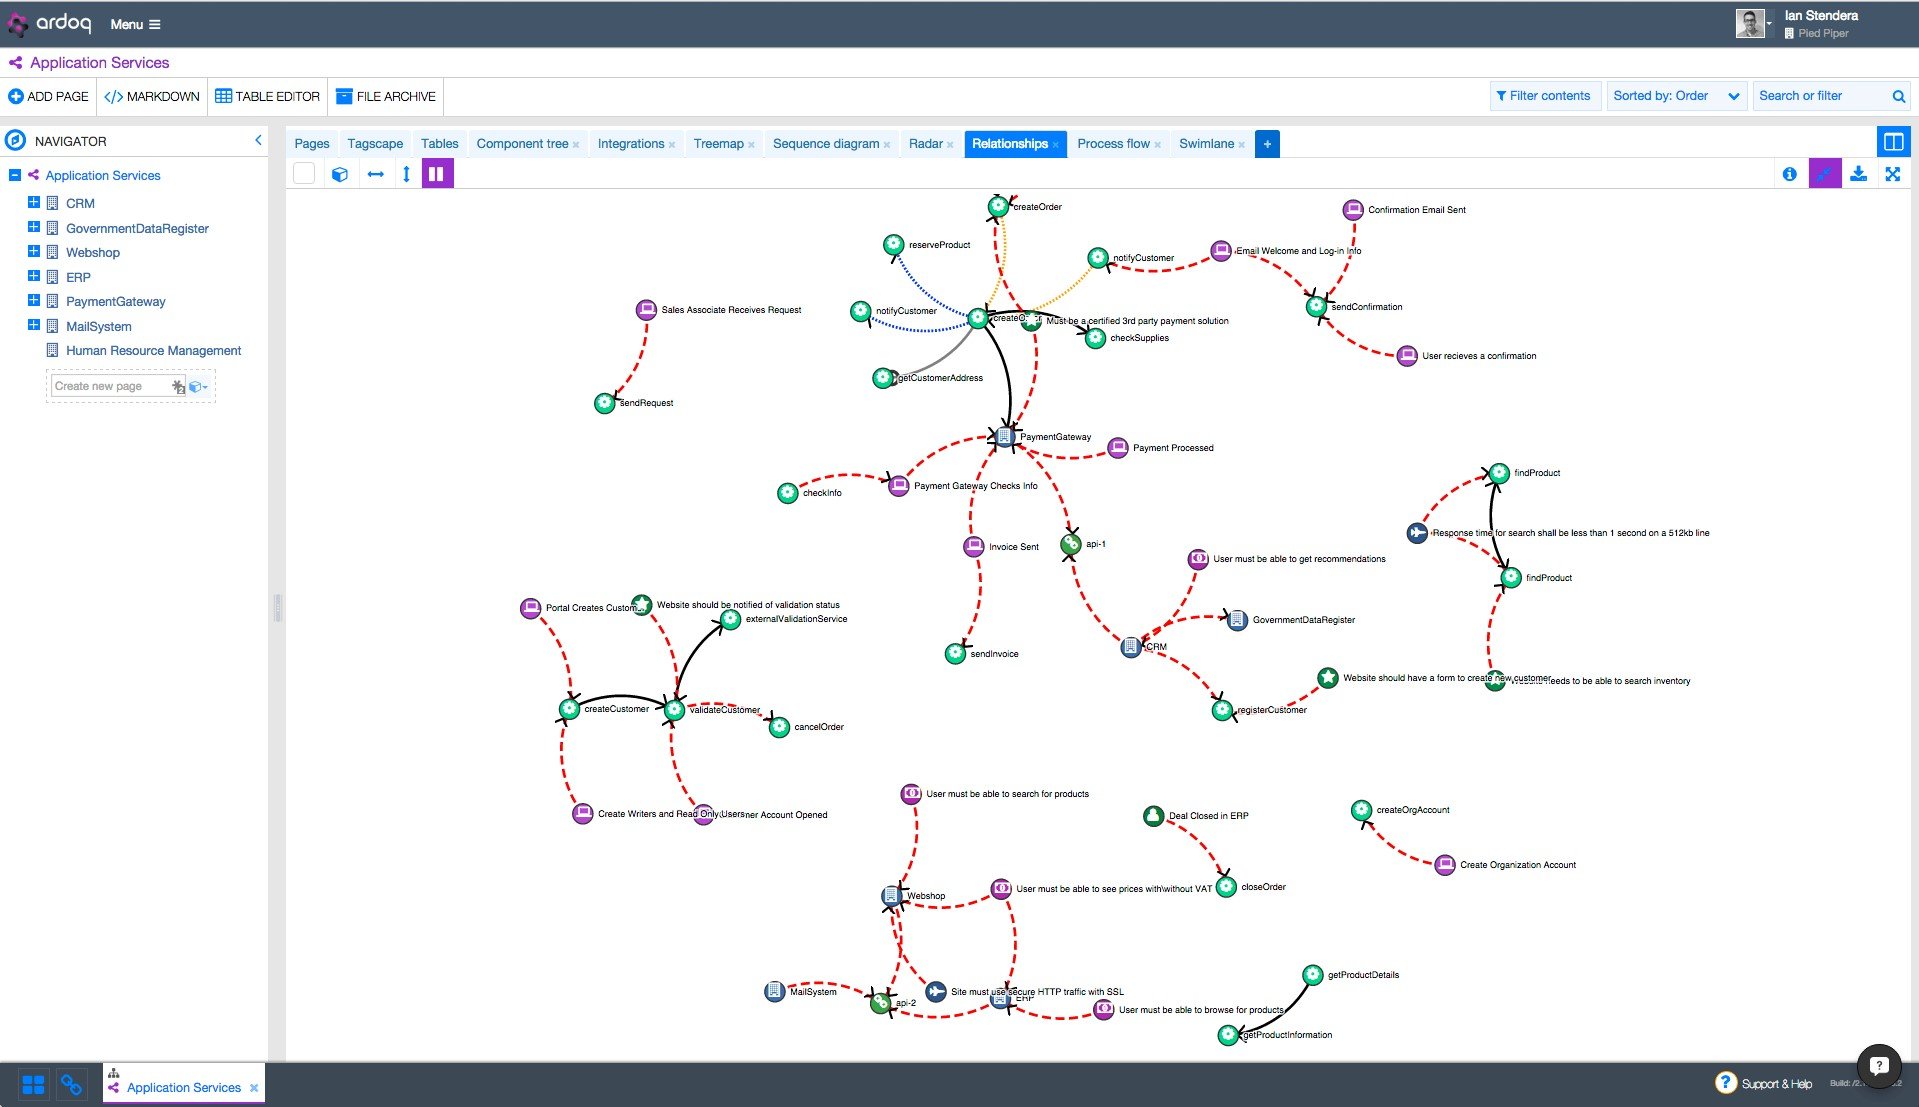
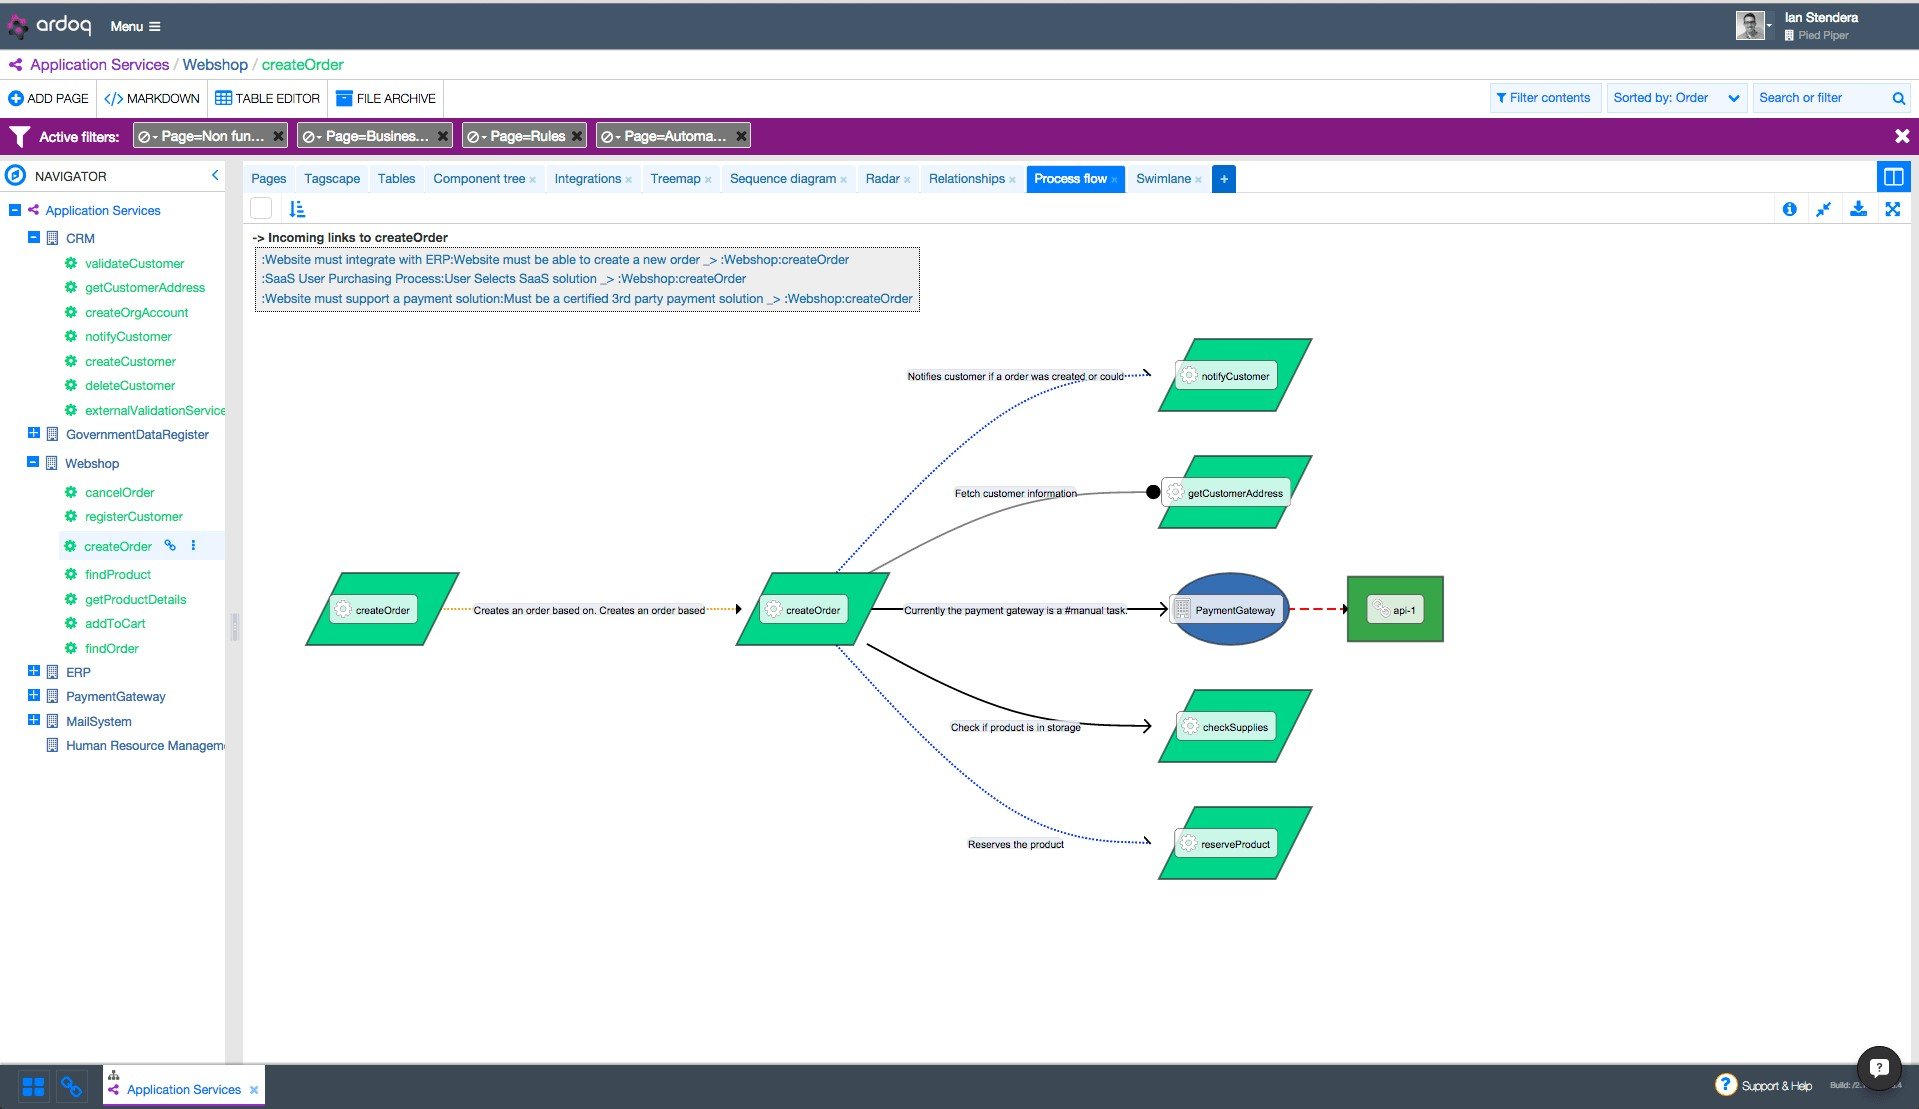
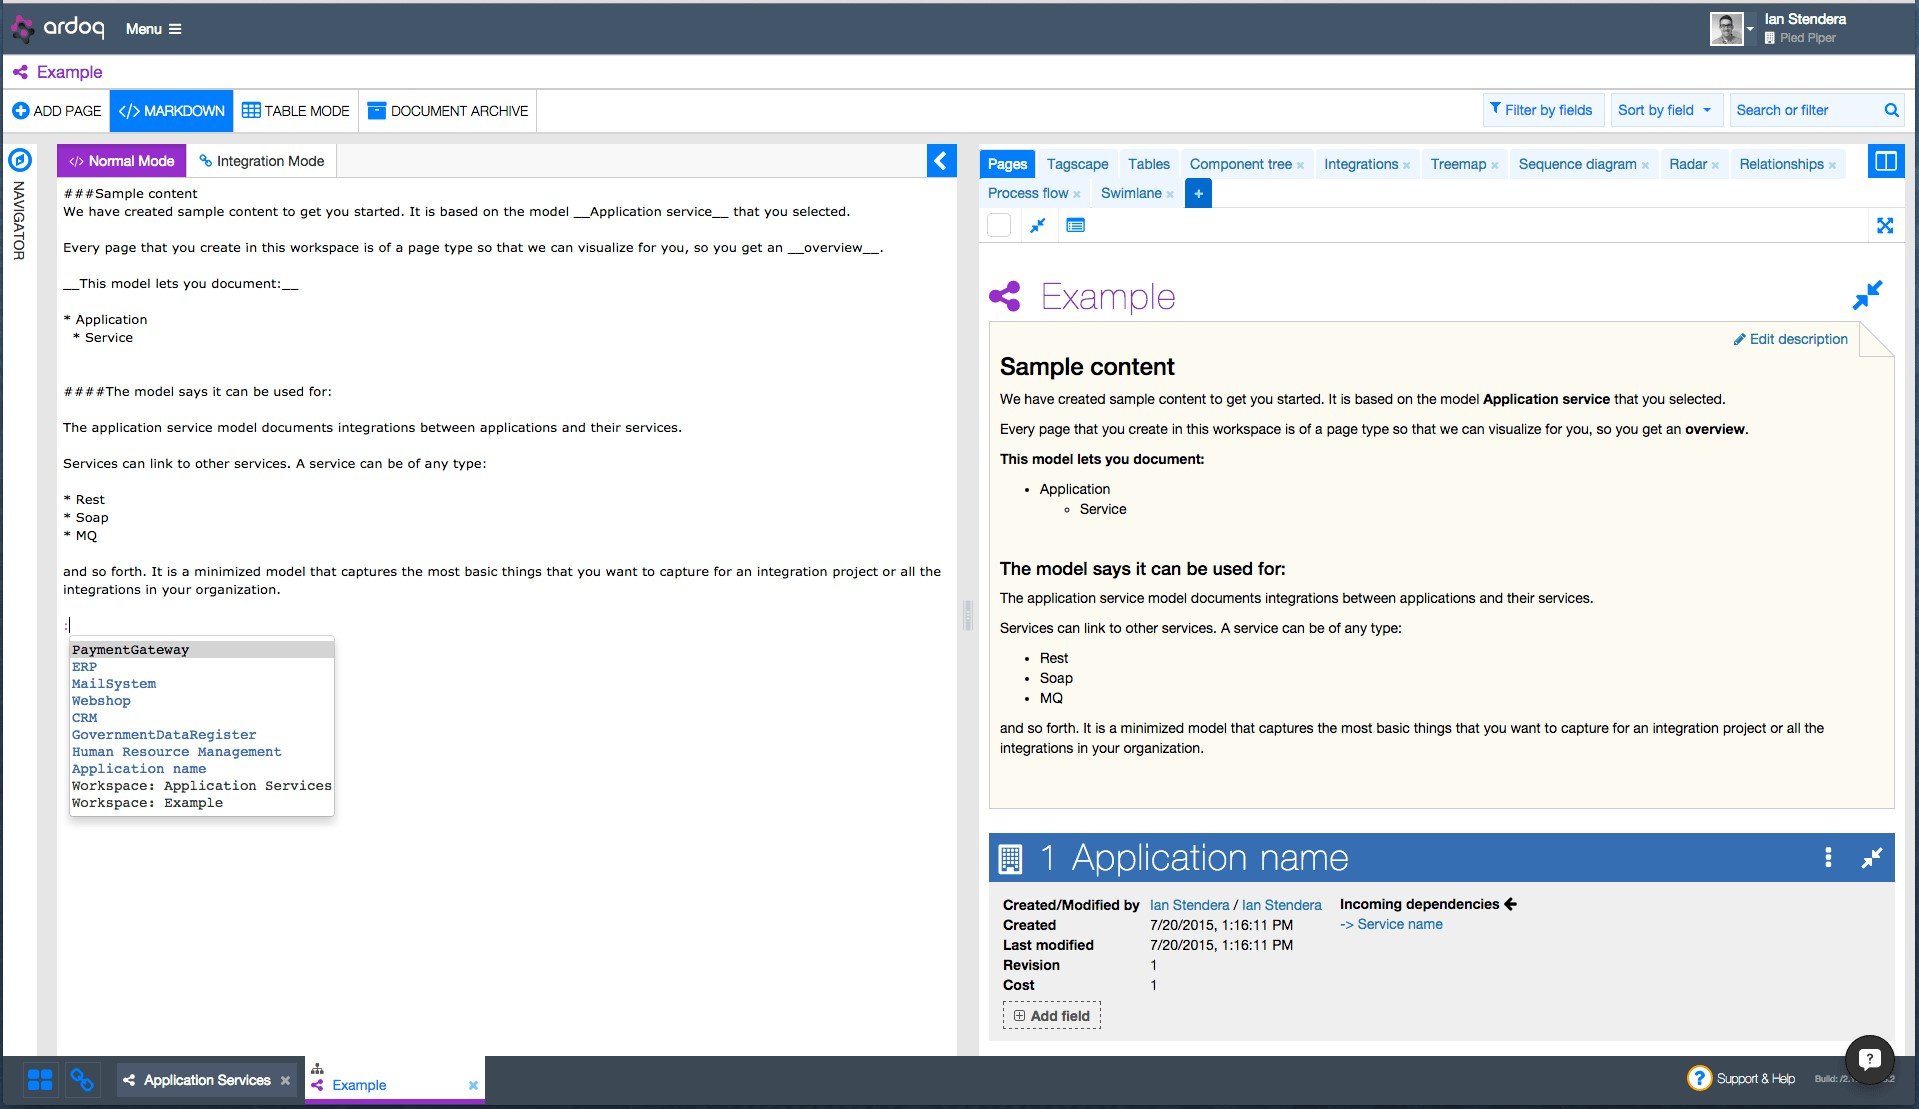
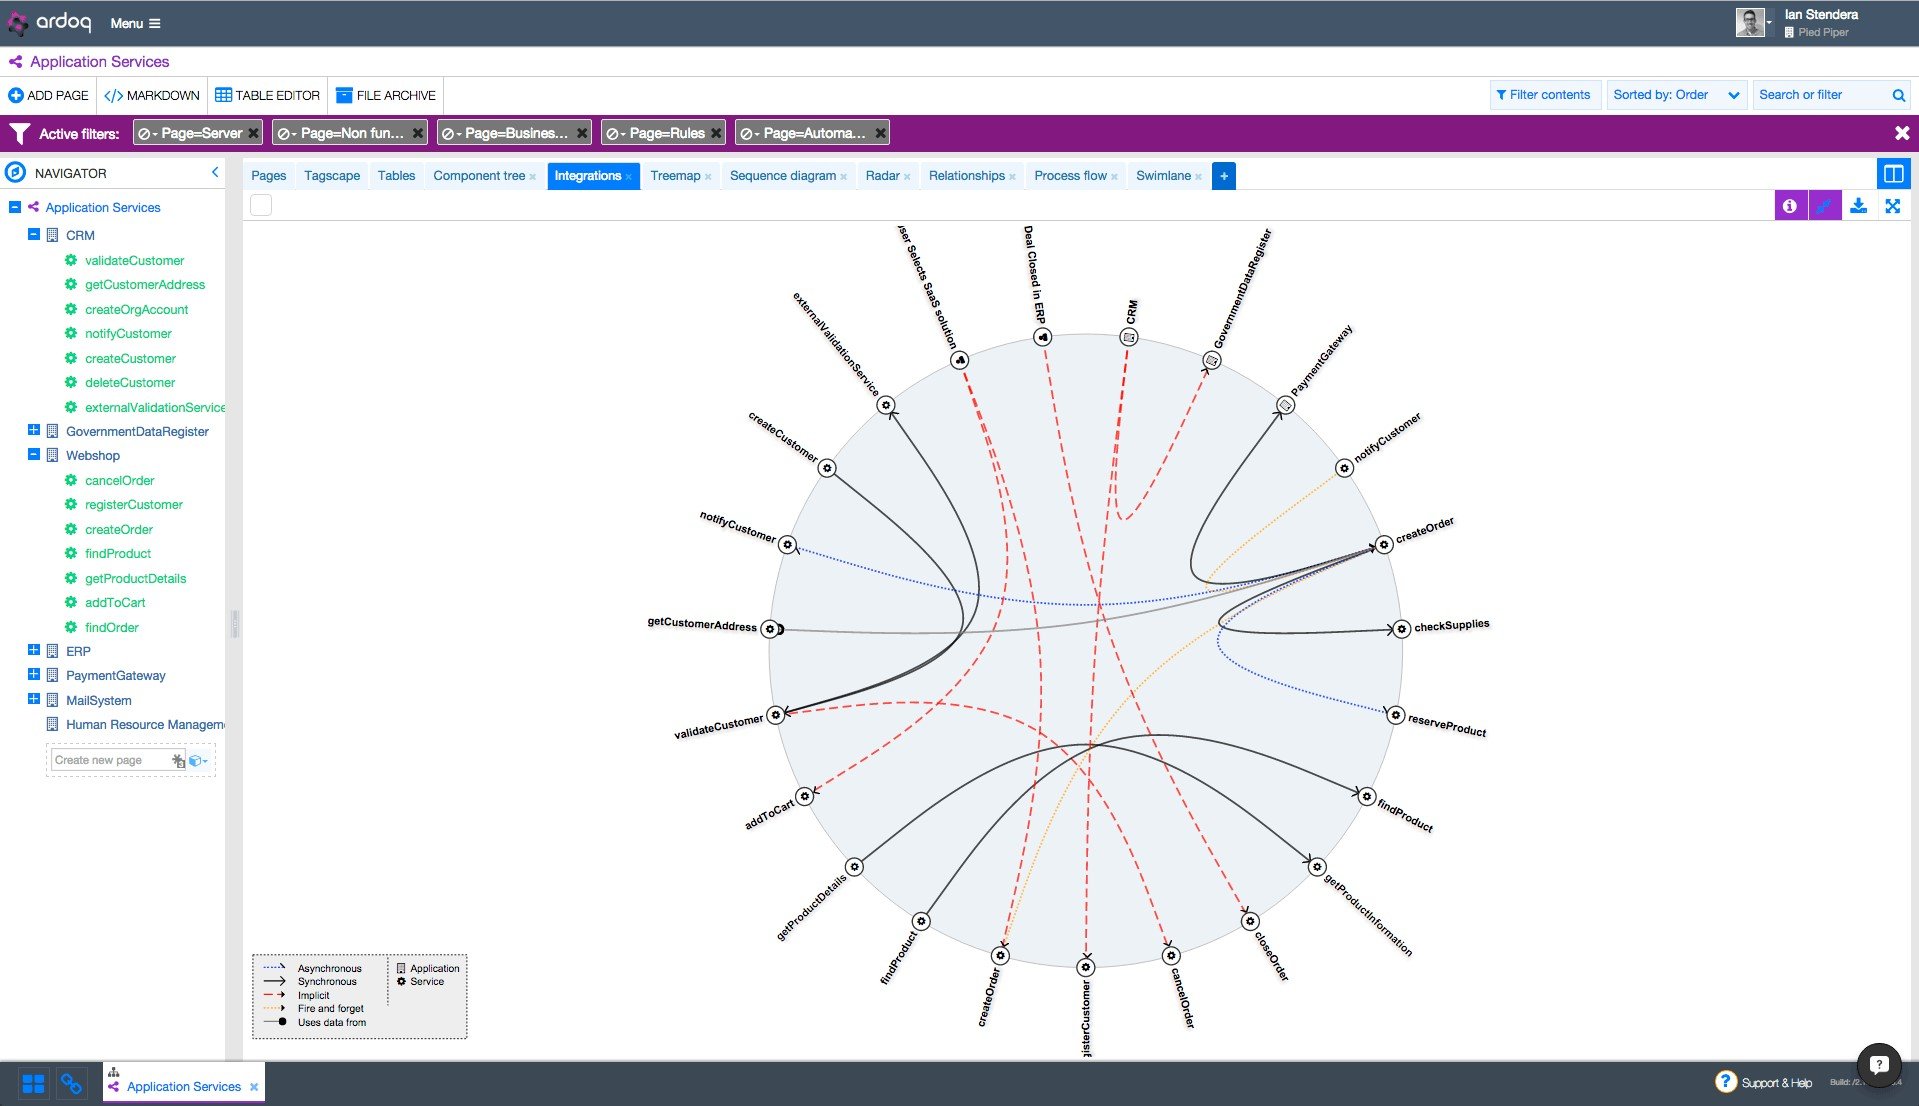
Ardoq is a data-based documentation platform with a focus on connecting the business and IT sides of your organization. Our auto-generated visualizations help you understand your systems at a conceptual or strategic level. This makes Ardoq a powerful tool for organizing unstructured data – something that is becoming more and more necessary at the enterprise planning level.
Unlike traditional documentation tools, content in Ardoq is structured and categorized by using fields, tags, and relationships with other pieces of content. This metadata lets you easily filter, search and explore related content. By providing this context to your documentation, it's much less likely to get lost and out-of-date.
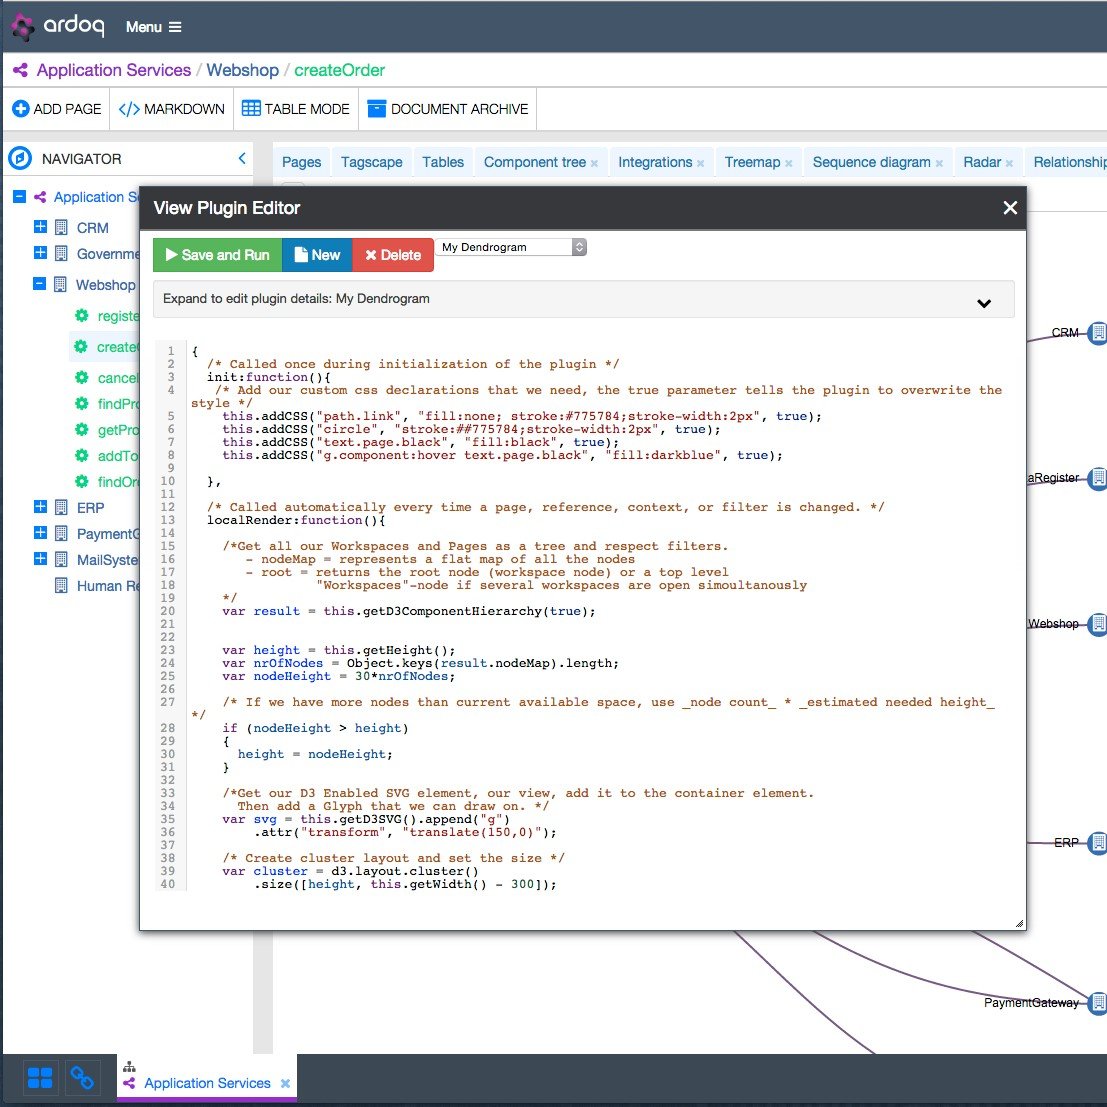
Ardoq offers a free 30-day trial, and features a REST API, integrations with other tools like Docker & Swagger, and out-of-the-box visualizations, including the process flow diagram, treemap, sequence diagram, swimlane, and lots more. You can also build your own visualizations using JavaScript.