TouchGraph is the producer of data visualization software TouchGraph Navigator 2.
TouchGraph is the producer of data visualization software TouchGraph Navigator 2.
Touchgraph Navigator 플랫폼
Windows
Linux
Touchgraph Navigator 비디오와 스크린샷
Touchgraph Navigator 개요
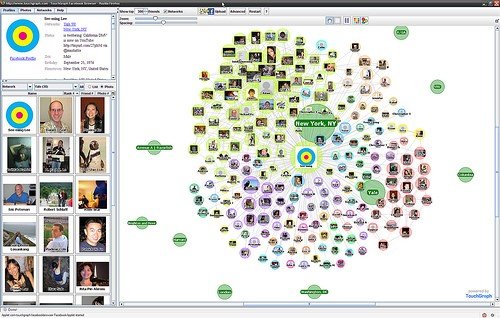
TouchGraph is the producer of data visualization software TouchGraph Navigator 2. With TouchGraph Navigator 2, users can upload data and create "interactive network visualizations."[1] Users can purchase licenses for either a TouchGraph Navigator Desktop version or TouchGraph Navigator Web, where the user hosts visualizations on their server and views the visualization on a web browser.[1]
사용하다
Users first load the data (in Excel, Csv, Tsv, Multi Csv, MySql, Nav DB API, Vna, Gdf, or Pajek formats), and they then can define:[2]
Data types and delimiters - Data type (integers, text, url, etc) and delimiters of table fields. Entities and relations - Specify how table data is transformed into Entity types and Relation types. Dynamic relations - Direct connections between entities which were only indirectly connected in the data. Dynamic attributes - Attribute that is derived from loaded data rather the being read directly from the file. Aliases - Renaming entities, relations, and attributes.
Users then define the settings
Names: Types/Attributes, Entity Labels Filter: Inclusion (which node types and edge types will be displayed in the graph), Attribute Filters (threshold values which determine which nodes and edges are displayed in the graph) Node Appearance: Colors, Halo Size/Shape, Label/Image, Node Tags Edge Appearance: Colors, Width/Pattern, Tags/Arrows Graph Layout