Tableau 替代品
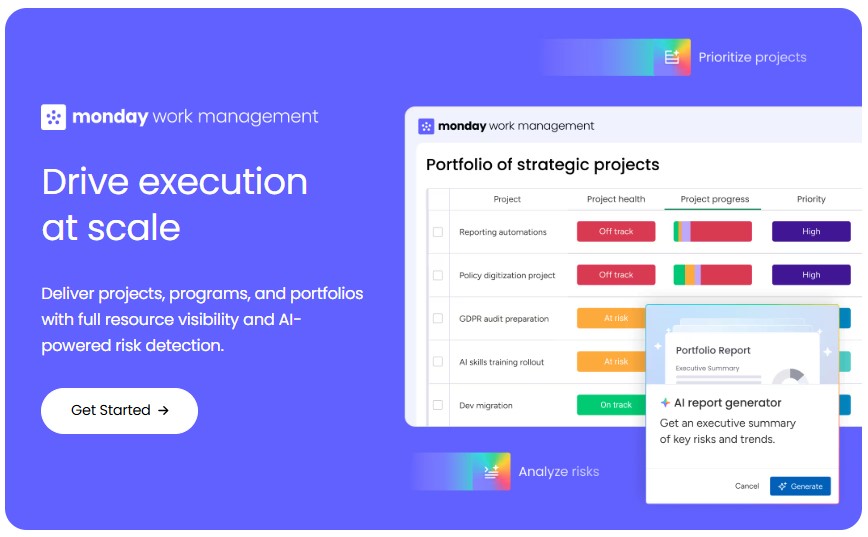
100我们整理了一个包含100个免费和付费的Tableau替代方案的列表。主要竞争对手包括:monday.com, Wrike。除了这些之外,用户还会将Tableau与Power BI, Sisense, ThoughtSpot进行比较。此外,您还可以在这里查看其他类似的选项:分析软件, 数据分析软件。
我们整理了一个包含100个免费和付费的Tableau替代方案的列表。主要竞争对手包括:monday.com, Wrike。除了这些之外,用户还会将Tableau与Power BI, Sisense, ThoughtSpot进行比较。此外,您还可以在这里查看其他类似的选项:分析软件, 数据分析软件。
我们整理了一个包含100个免费和付费的Tableau替代方案的列表。主要竞争对手包括:monday.com, Wrike。除了这些之外,用户还会将Tableau与Power BI, Sisense, ThoughtSpot进行比较。此外,您还可以在这里查看其他类似的选项:分析软件, 数据分析软件。

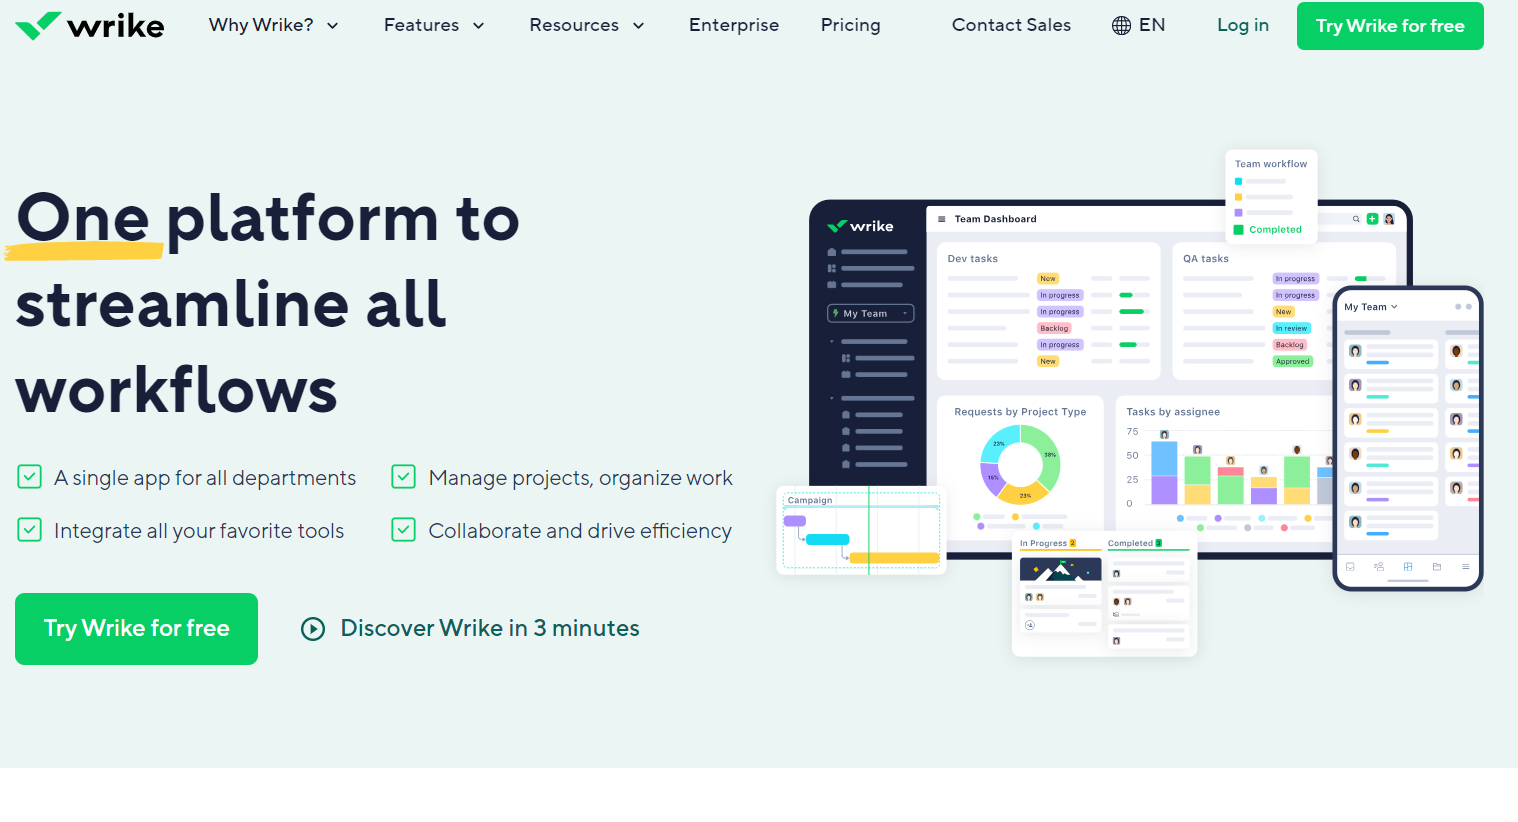
这是一个基于云的多功能平台,可优化项目管理和团队协作。它可提高软件开发、市场营销、销售 CRM、人力资源等领域的工作效率,实现无缝任务跟踪、截止日期管理和分析,从而提高项目绩效。
ThoughtSpot 是一款人工智能驱动的分析工具,可让您用自然语言提出数据问题并获得准确答案。它能让你分析、探索和分享数据见解,连接各种数据源,并灵活地建立数据模型。除核心功能外,该解决方案还提供无限下钻、自动可视化和人工智能驱动的模式分析等功能,并可使用其对开发人员友好的 SDK 将其嵌入到其他产品中。
Databricks 数据智能平台由生成式人工智能驱动,为有效的元数据管理、可视化和数据自动化提供用户友好型工具。该平台基于 Apache Spark,可提供快速、可扩展的实时数据分析。
分享您对软件的看法,留下评论,帮助使其变得更好!
建議更改
你的反馈
Your vote has been counted.
Do you have experience using this software?