झांकी एक शक्तिशाली डेटा विज़ुअलाइज़ेशन और व्यावसायिक खुफिया उपकरण है जो आपको एक इंटरैक्टिव और सार्थक तरीके से डेटा का विश्लेषण और कल्पना करने की अनुमति देता है. यह उपयोगकर्ताओं को विभिन्न डेटा स्रोतों से कनेक्ट करने, डैशबोर्ड बनाने और अंतर्दृष्टि साझा करने में सक्ष…
FineReport is a powerful and efficient reporting tool allows you to creat complex reports with no...
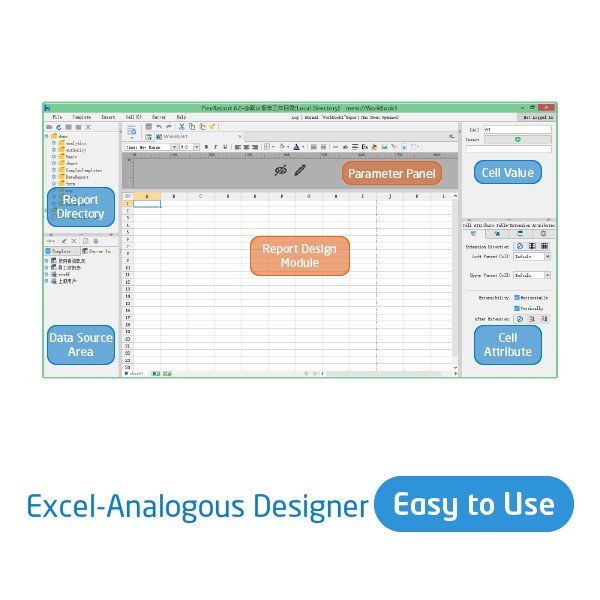
FineReport is a powerful and efficient reporting tool allows you to creat complex reports with no...
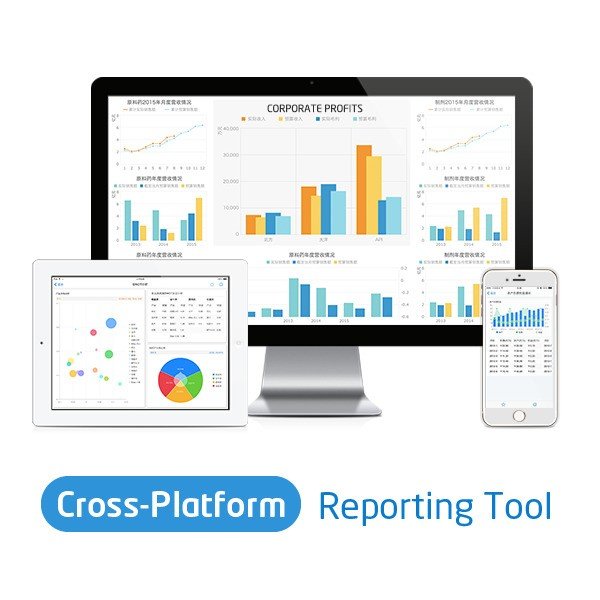
FineReport प्लेटफ़ॉर्म
Windows
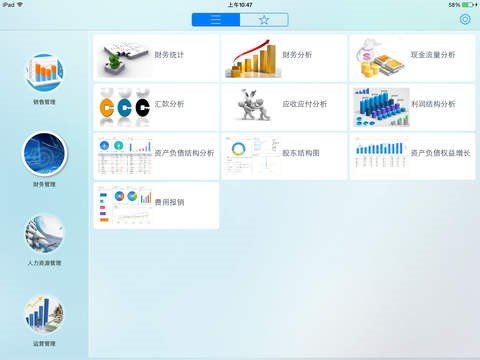
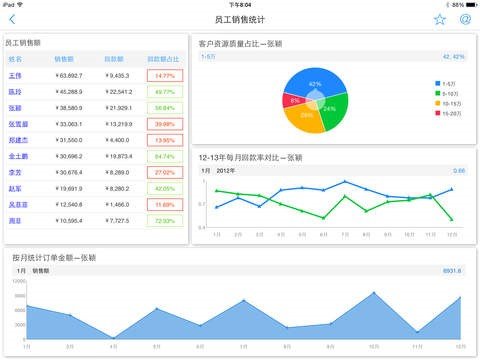
iPad
Mac
Android
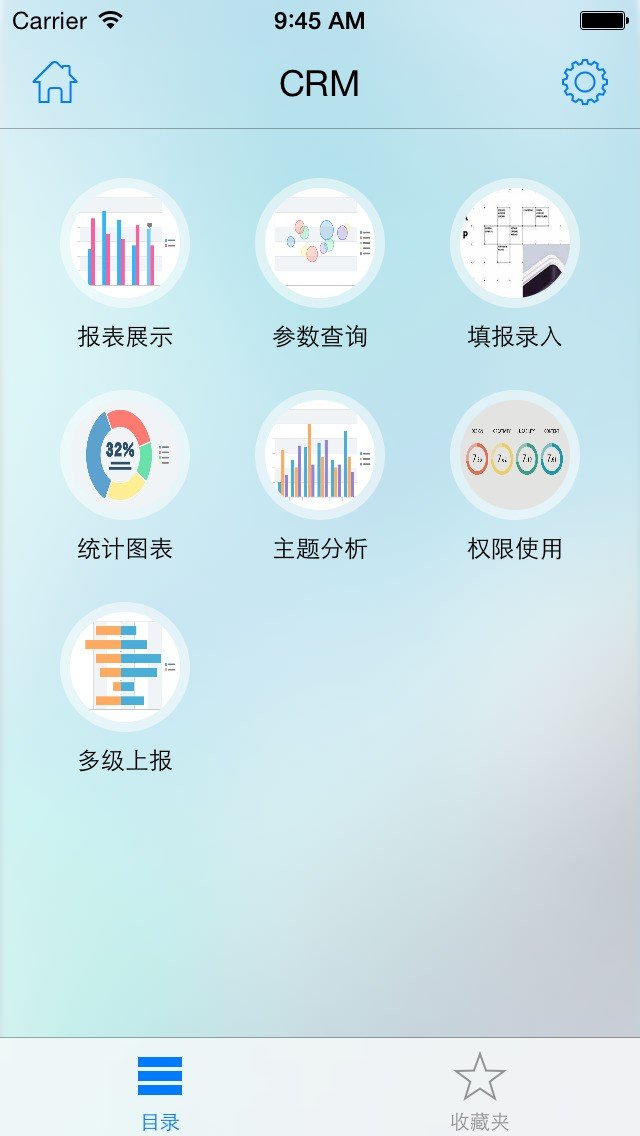
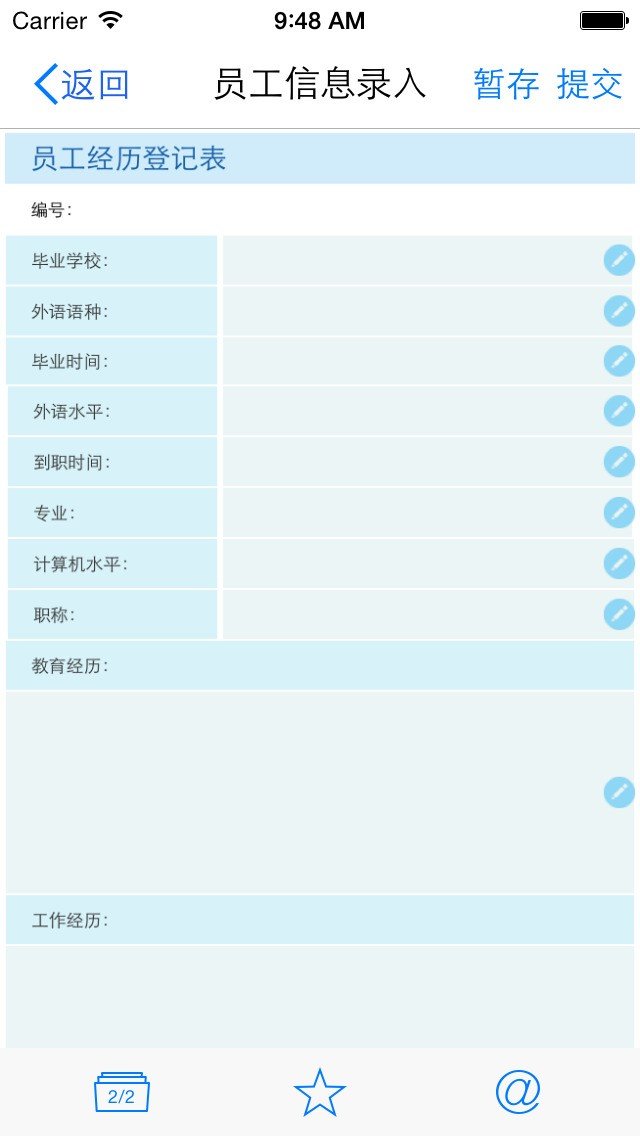
iPhone
FineReport वीडियो और स्क्रीनशॉट
FineReport अवलोकन
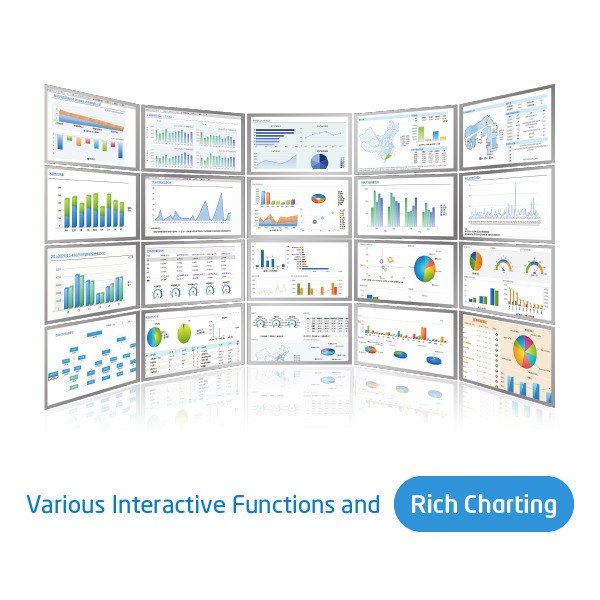
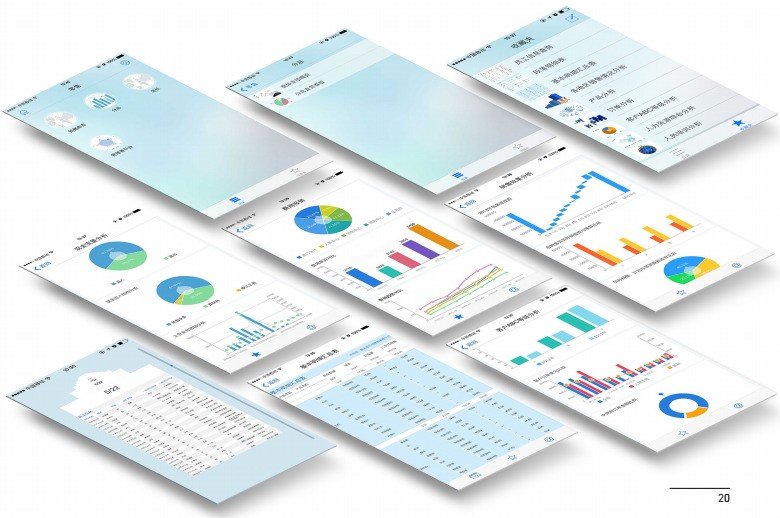
FineReport is a powerful and efficient reporting tool allows you to creat complex reports with no IT help and supports a wide variety of data sources. 1. Complex reports: supports multi-source data correlation, row (column) symmetry, column-break/page-break/group-break reports, dynamic inter-cell calculation, functions (formats), aggregate reports. 2. Data support: common database/BI multi-dimensional database/standard data source/program, text data source/stored procedures. 3. Data filling: filling verification and control/multi-filling patterns/multi-source filling/self-filling/column filling/cross filling/multi-stage reporting 4. Design mode: Excel-analogous designer/multi-working directory and remote design/multi-department and multi-person collaboration 5. Interactive analysis: HTML5 chart/chart linkage/data linkage/multi-data drilling/drilling of any combination/infinite hierarchy drilling/multi-dimensional data analysis/real-time analysis 6. Import and export: supports import and export in almost any format; APPLET, .pdf and Flash printing and multi-print control 7. Charts: HTML5 chart technology/17 chart types/52 chart patterns/data map/flexible parameter passing and rich interactive effects 8. Dashboard: supports adaptive screen, independent component refreshing and the construction of a 'management cockpit' via dashboards, charts and various interactive functions. 9. Parameter controls: visualized drag and drop, flexible layout/direct utilization of rich parameter controls 10. Scheduled dispatch: scheduled generation of daily, monthly, quarterly and annual reports, notification by email/scheduled filling to achieve scheduled loading, summary and filling of data into database 11. Authority control: single sign-on/rich authority authentications and refined authority control plans/report module encryption/easy operation Secondary development, reporting system management, mobile application, easy and quick application and deployment and so on.