अपनी भाषा चुनें

होम पेज arrow-right ... arrow-right एनालिटिक्स सॉफ्टवेयर arrow-right डेटा विश्लेषण सॉफ्टवेयर arrow-right Tableau

हमने 139 मुफ्त और भुगतान करने वाले Tableau के विकल्पों की सूची तैयार की है। मुख्य प्रतिस्पर्धी में शामिल हैं VWO Insights, VWO Engage (PushCrew)। उनके अलावा, उपयोगकर्ताओं द्वारा Tableau और VWO Data360, VWO Insights - Mobile App, VWO Testing के बीच तुलनाएँ भी की जाती हैं। इसके अलावा, यहाँ आप अन्य समान विकल्पों को भी देख सकते हैं: एनालिटिक्स सॉफ्टवेयर, डेटा विश्लेषण सॉफ्टवेयर


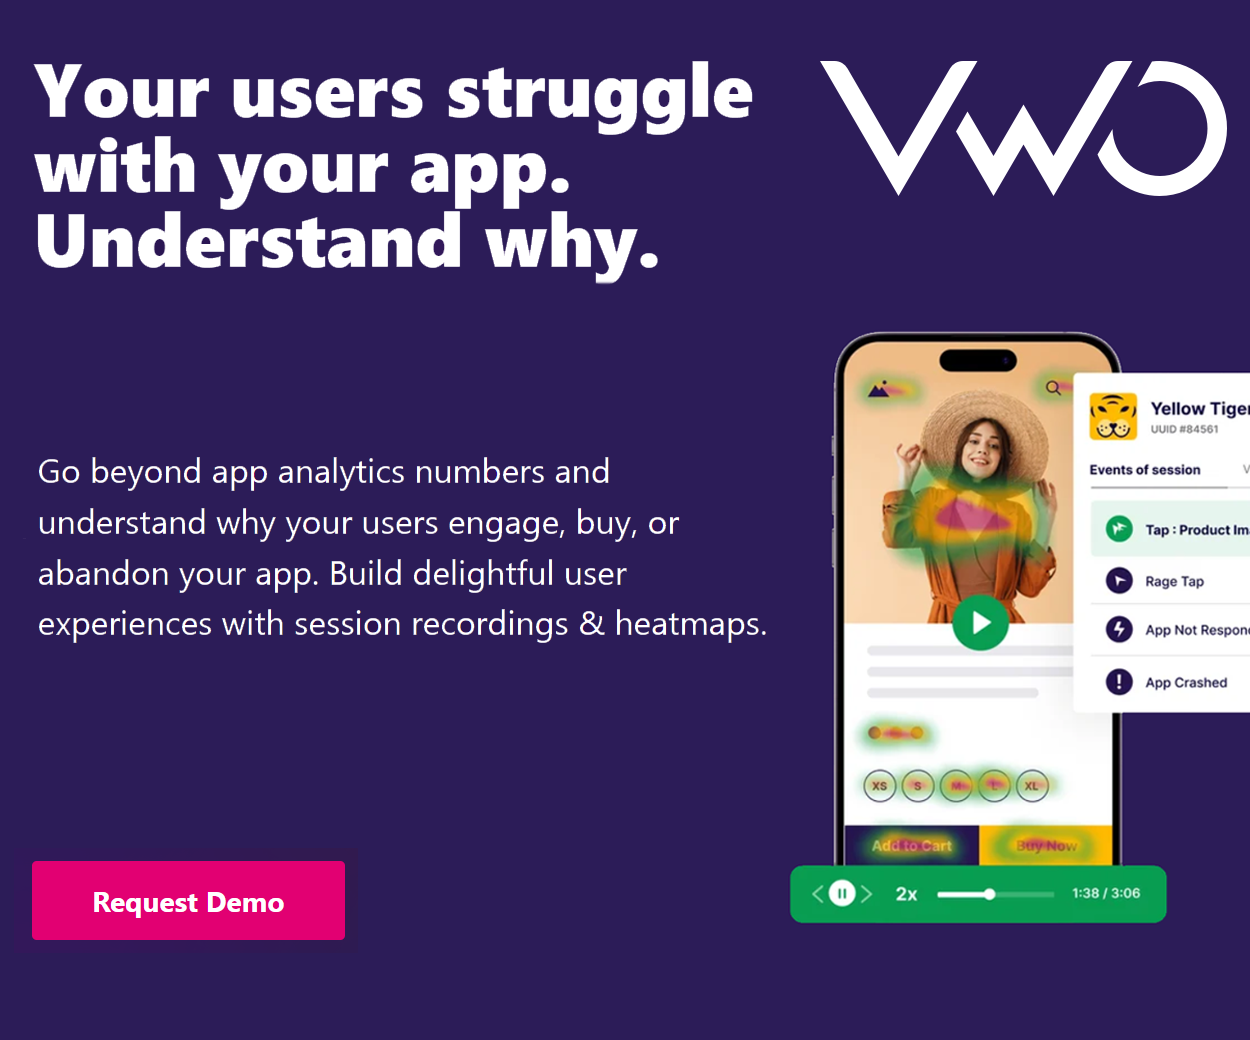
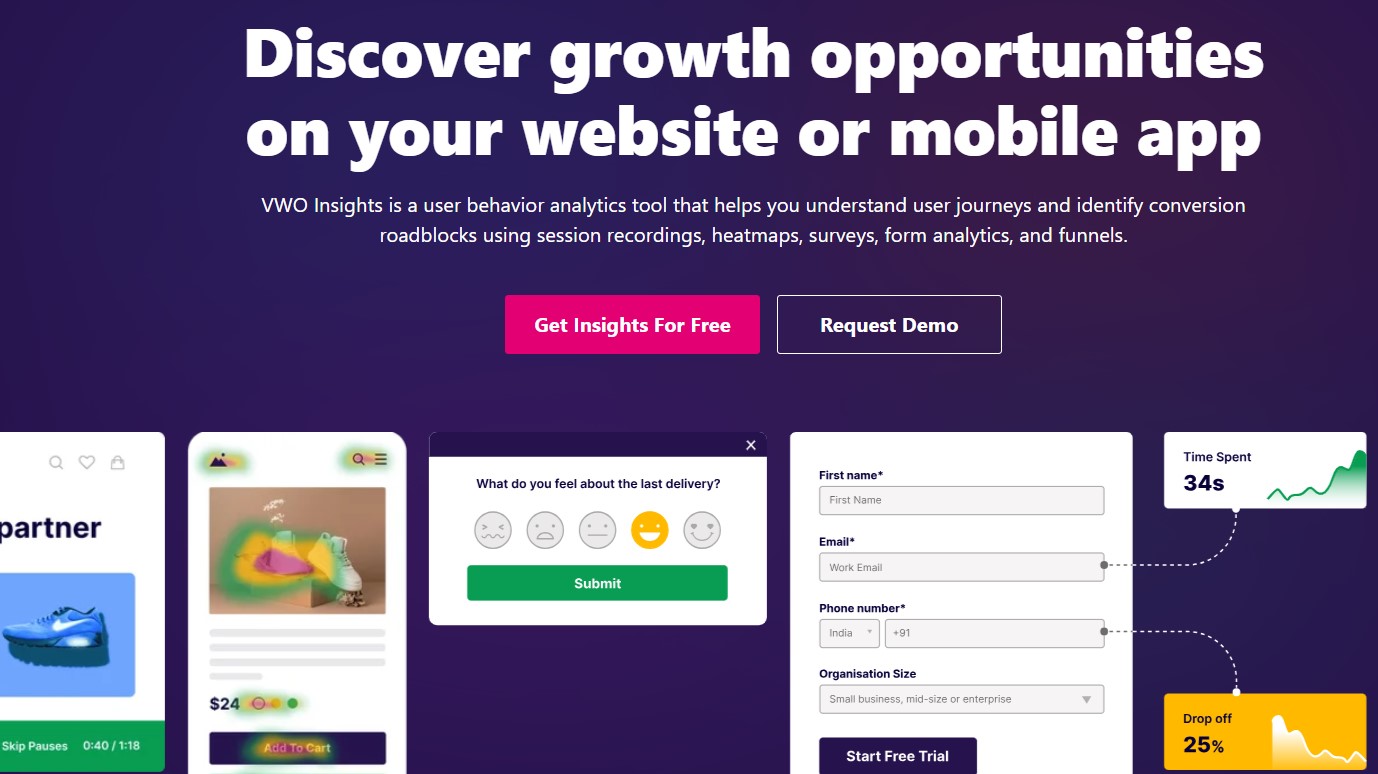
VWO इनसाइट्स के साथ उपयोगकर्ता व्यवहार को समझकर अपनी वेबसाइट या मोबाइल ऐप के विकास को बढ़ावा दें। वेबसाइट और ऐप के प्रदर्शन को बढ़ाने के लिए सत्र रिकॉर्डिंग, हीटमैप, सर्वेक्षण और बहुत कुछ का उपयोग करें।

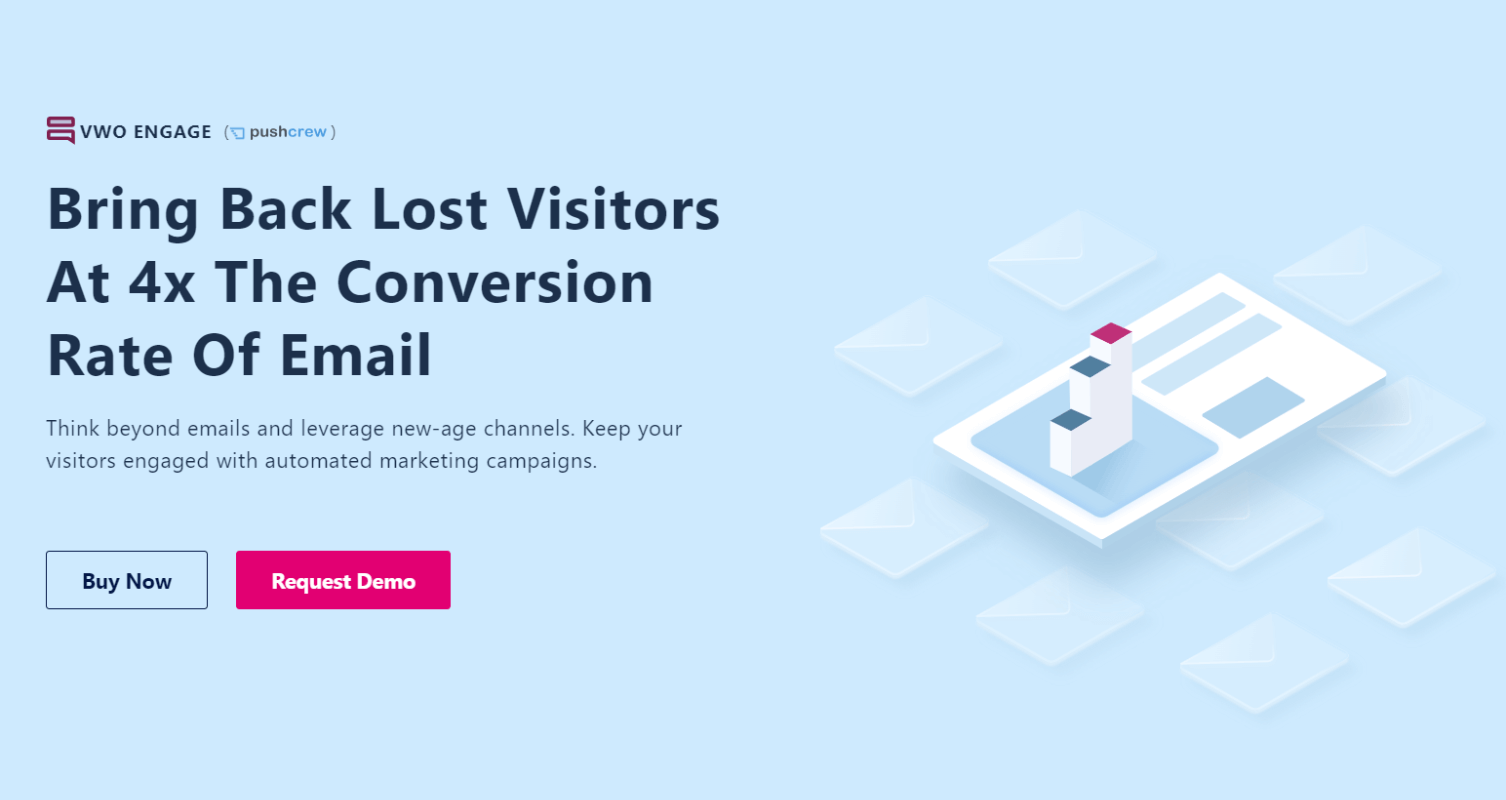
VWO एंगेज लक्षित सूचनाओं के माध्यम से उपयोगकर्ता की व्यस्तता को बढ़ाता है. यह उपकरण वेबसाइट पर उपयोगकर्ता कार्यों द्वारा ट्रिगर किए गए प्रचार, कार्ट रिमाइंडर और सदस्यता अनुरोधों जैसे व्यक्तिगत संदेशों के निर्माण में सक्षम बनाता है.

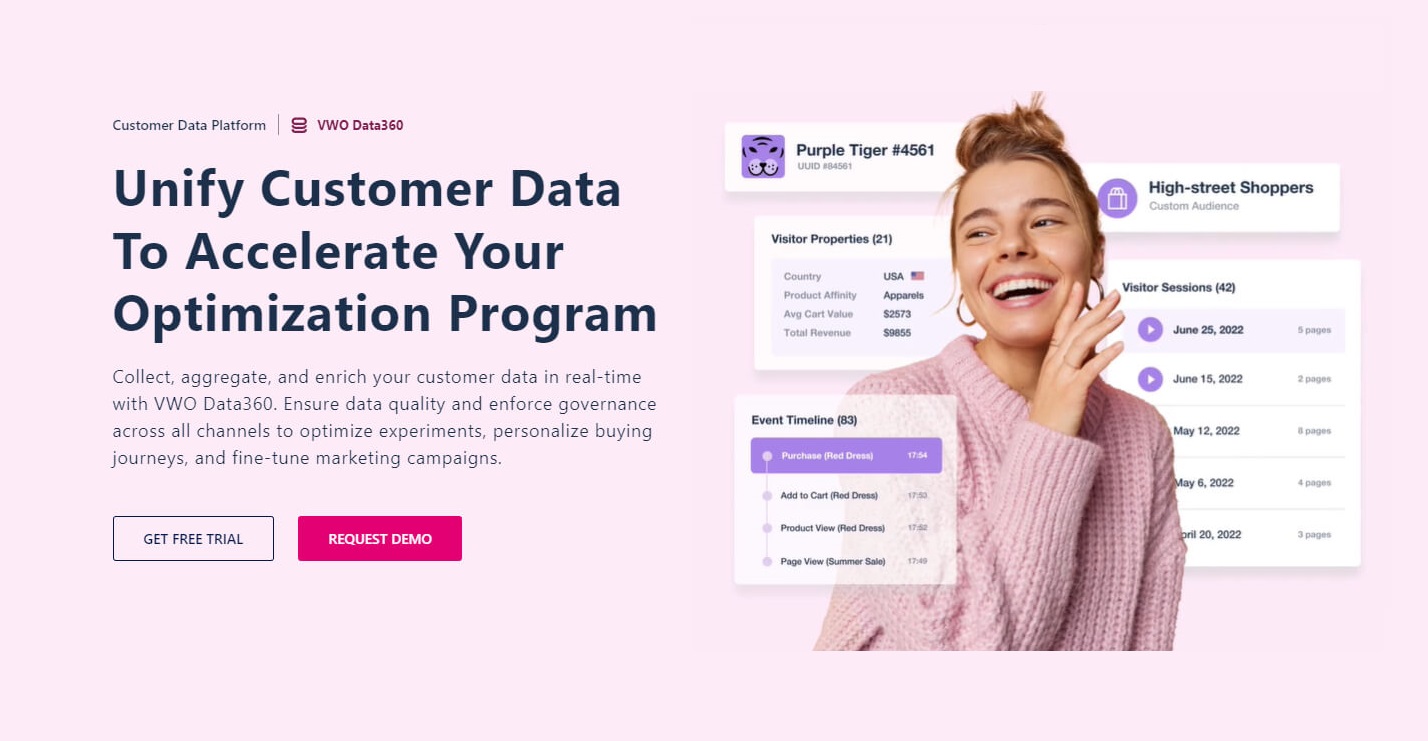
VWO Data360: उन्नत डेटा एनालिटिक्स और ऑप्टिमाइज़ेशन प्लेटफ़ॉर्म. वेब एनालिटिक्स, सीआरएम और अधिक से हार्नेस अंतर्दृष्टि. डिजिटल उत्पादों को बेहतर बनाने के लिए एमएल / एआई का उपयोग करके स्वचालित परीक्षण सूचित निर्णय लेने के लिए मजबूत रिपोर्टिंग और डेटा दृश्य प्रदान करता…

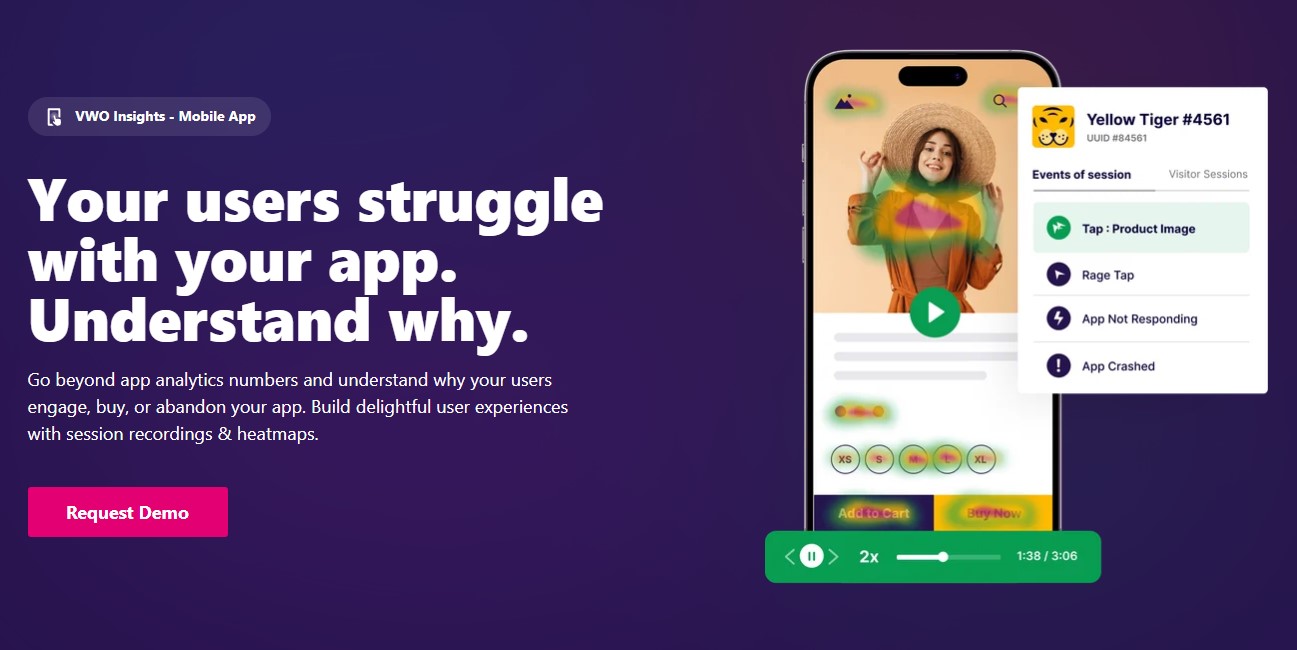
मोबाइल एप्लिकेशन के लिए VWO इनसाइट्स वास्तविक समय वेबसाइट ट्रैफ़िक डेटा, ए / बी प्रयोग अपडेट और विस्तृत विश्लेषिकी प्रदान करता है. मेट्रिक्स की निगरानी करें, प्रयोग सूचनाएं प्राप्त करें, परिणामों का विश्लेषण करें, और अपने स्मार्टफोन या टैबलेट पर महत्वपूर्ण रिपोर्ट को आ…

VWO Testing
Free Trial Subscription

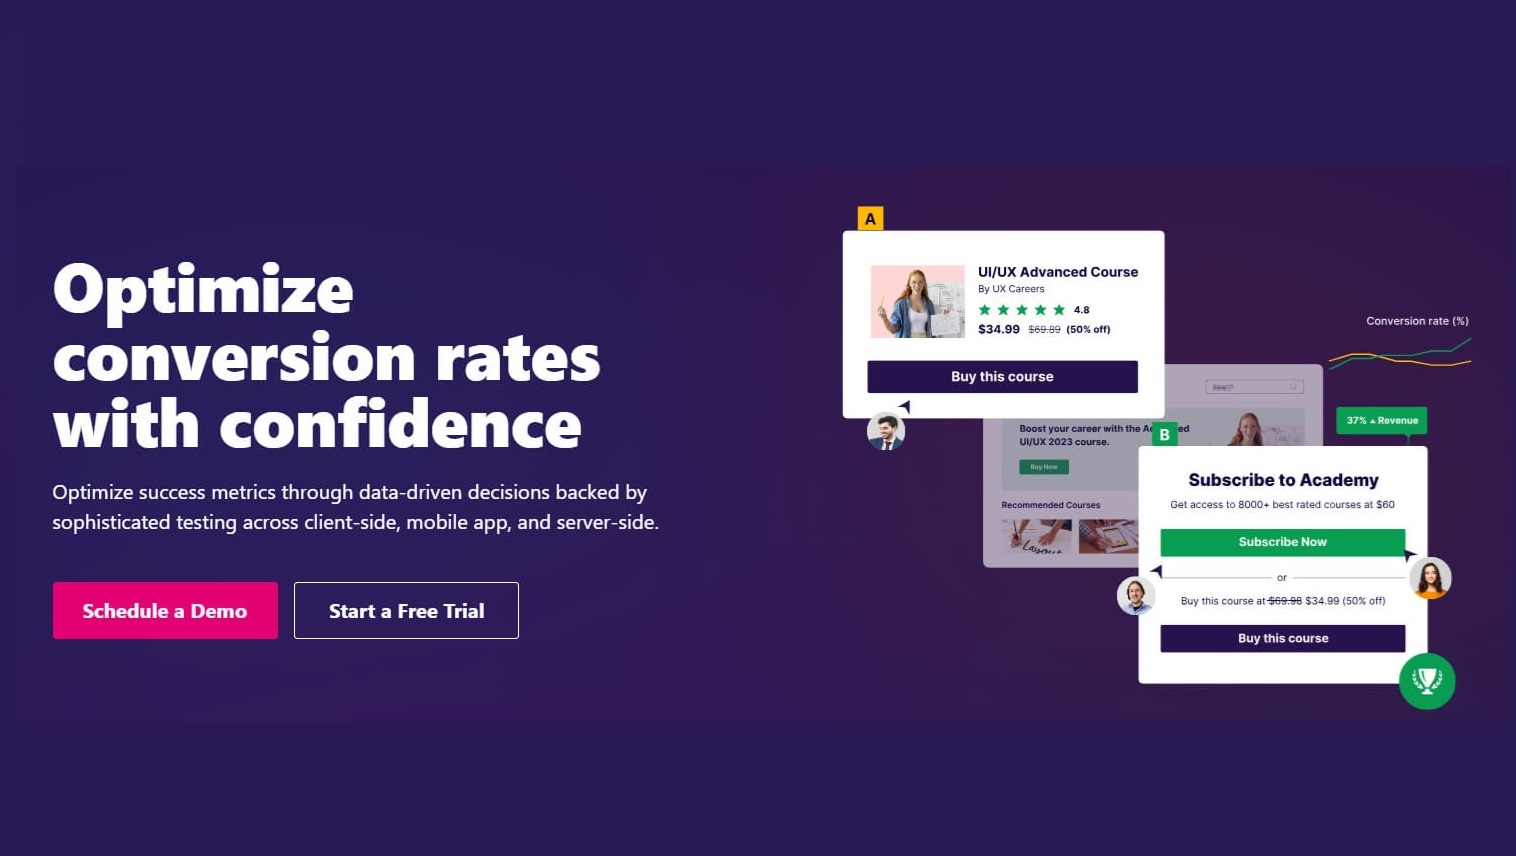
VWO परीक्षण वेबसाइटों और अनुप्रयोगों के लिए एक उन्नत A / B और बहुभिन्नरूपी परीक्षण उपकरण है. पृष्ठ तत्वों पर परीक्षण आयोजित करें, रूपांतरणों का विश्लेषण करें, और दृश्य संपादन, एसएसओ प्रमाणीकरण, व्यवहार लक्ष्यीकरण और मजबूत विश्लेषिकी जैसी सुविधाओं के साथ उपयोगकर्ता …

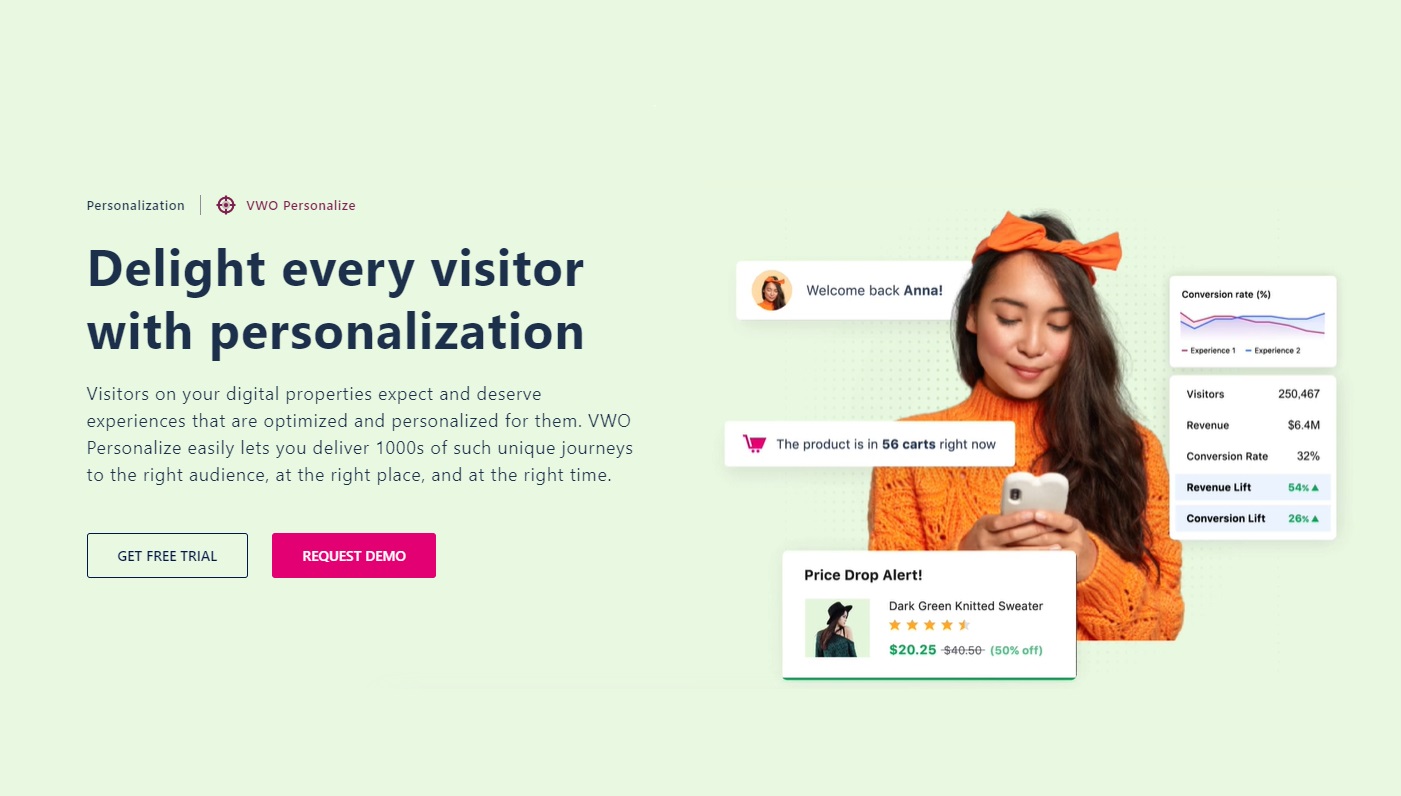
VWO एक मजबूत निजीकरण इंजन के साथ उच्च-परिवर्तित वेबसाइटों को निजीकृत करता है. डिवाइस, ब्राउज़िंग व्यवहार और तीसरे पक्ष के अंतर्दृष्टि जैसे हार्नेस विज़िटर डेटा दर्जी विशिष्ट अभियानों के लिए. ब्राउज़र संपत्तियों, सगाई डेटा और तीसरे पक्ष के एपीआई के संयोजन के साथ एक …

Microsoft Office Excel एक वाणिज्यिक स्प्रेडशीट अनुप्रयोग है।

SAS Viya
Free Trial Subscription

एसएएस विया एआई-संचालित और एनालिटिक्स प्लेटफॉर्म, डेटा एकीकरण, मॉडल विकास और क्लाउड खर्चों को कम करता है. क्लाउड-देशी क्षमताओं के साथ, यह सहयोग को बढ़ावा देता है, विविध डेटा प्रकारों का समर्थन करता है, और कुशल, पारदर्शी और स्वचालित एआई और एनालिटिक्स प्रक्रियाओं को …

Sisense
Subscription

बिजनेस इंटेलिजेंस प्लेटफॉर्म जो डेटा एनालिटिक्स और विज़ुअलाइज़ेशन समाधान प्रदान करता है. यह जटिल डेटा सेटों का विश्लेषण करने और उनके व्यावसायिक प्रदर्शन में बेहतर अंतर्दृष्टि के लिए इंटरैक्टिव डैशबोर्ड बनाने में सक्षम बनाता है. यह डेटा एकीकरण, दृश्य और साझाकरण क्षमत…

Google Analytics एक शक्तिशाली वेब विश्लेषिकी सेवा है जो आपको वेबसाइट ट्रैफ़िक को ट्रैक और विश्लेषण करने की अनुमति देती है। Google Analytics के साथ, आप इस बात की जानकारी प्राप्त कर सकते हैं कि उपयोगकर्ता आपकी वेबसाइट के साथ कैसे बातचीत करते हैं, वे कहाँ से आत…

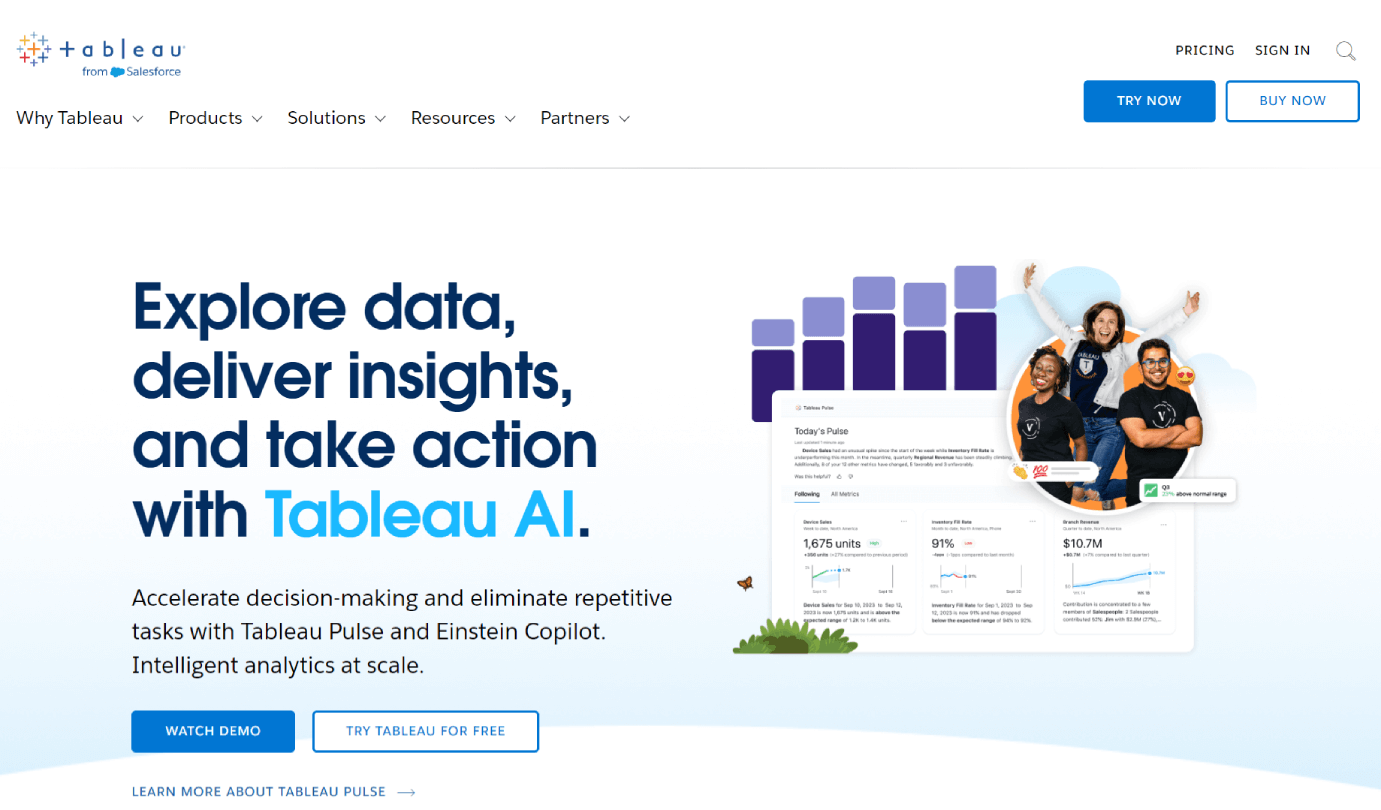
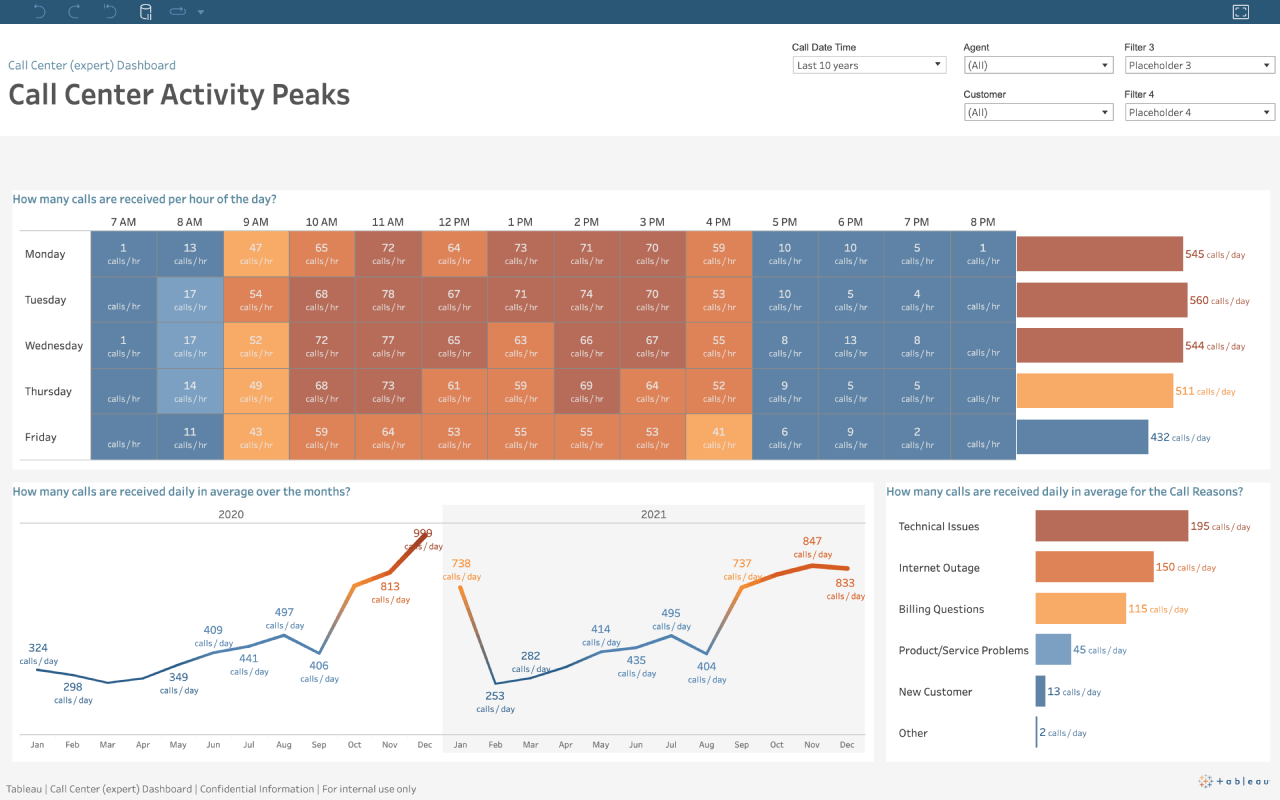
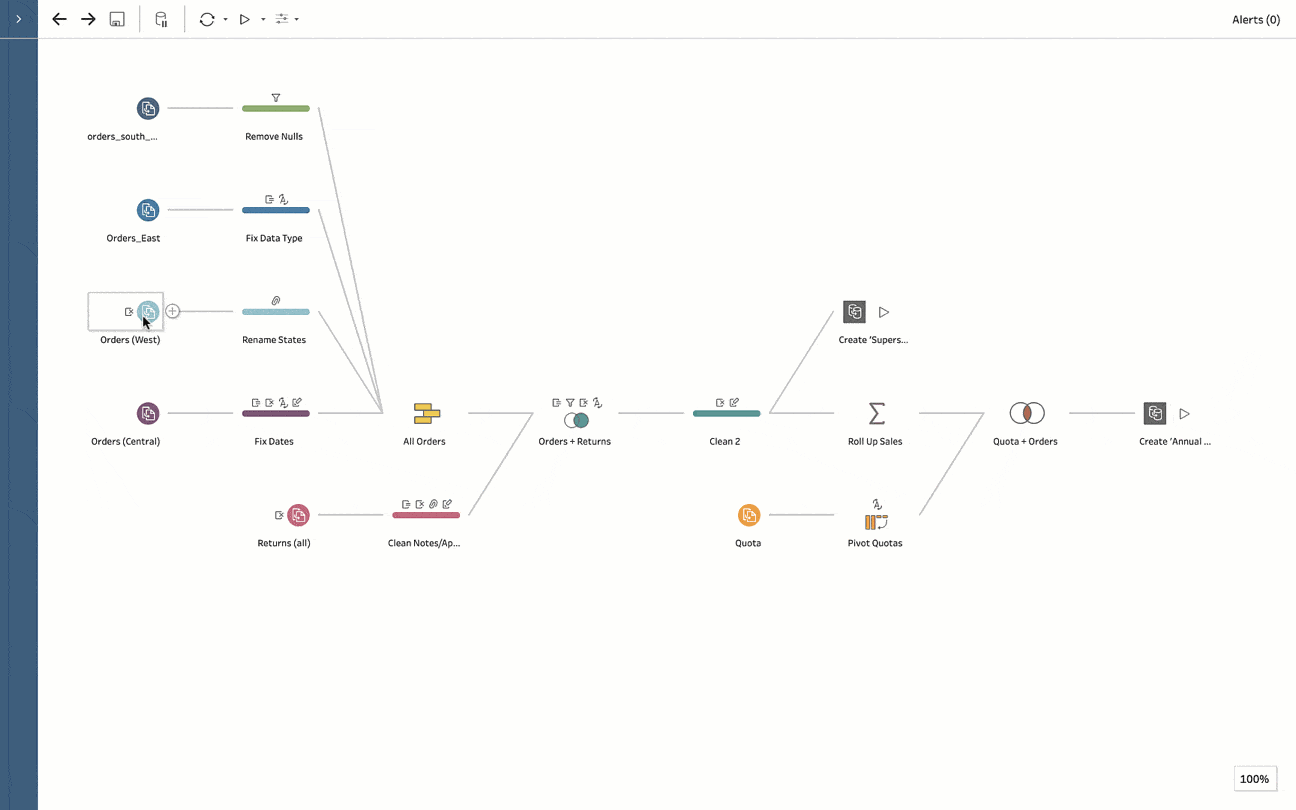
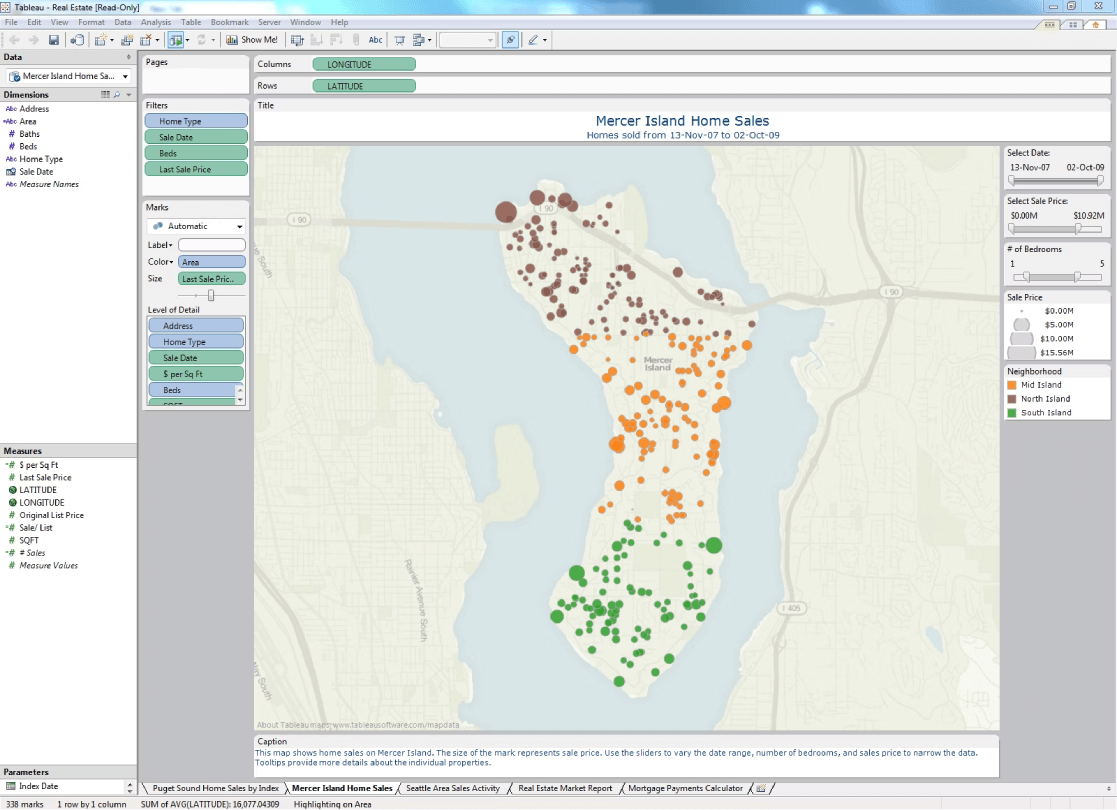
झांकी एक शक्तिशाली डेटा विज़ुअलाइज़ेशन और व्यावसायिक खुफिया उपकरण है जो आपको एक इंटरैक्टिव और सार्थक तरीके से डेटा का विश्लेषण और कल्पना करने की अनुमति देता है. यह उपयोगकर्ताओं को विभिन्न डेटा स्रोतों से कनेक्ट करने, डैशबोर्ड बनाने और अंतर्दृष्टि साझा करने में सक्षम बनाता है.

Tableau प्लेटफ़ॉर्म

tick-square Windows
tick-square Web-Based
tick-square Linux
tick-square Mac

Tableau वीडियो और स्क्रीनशॉट

Tableau अवलोकन

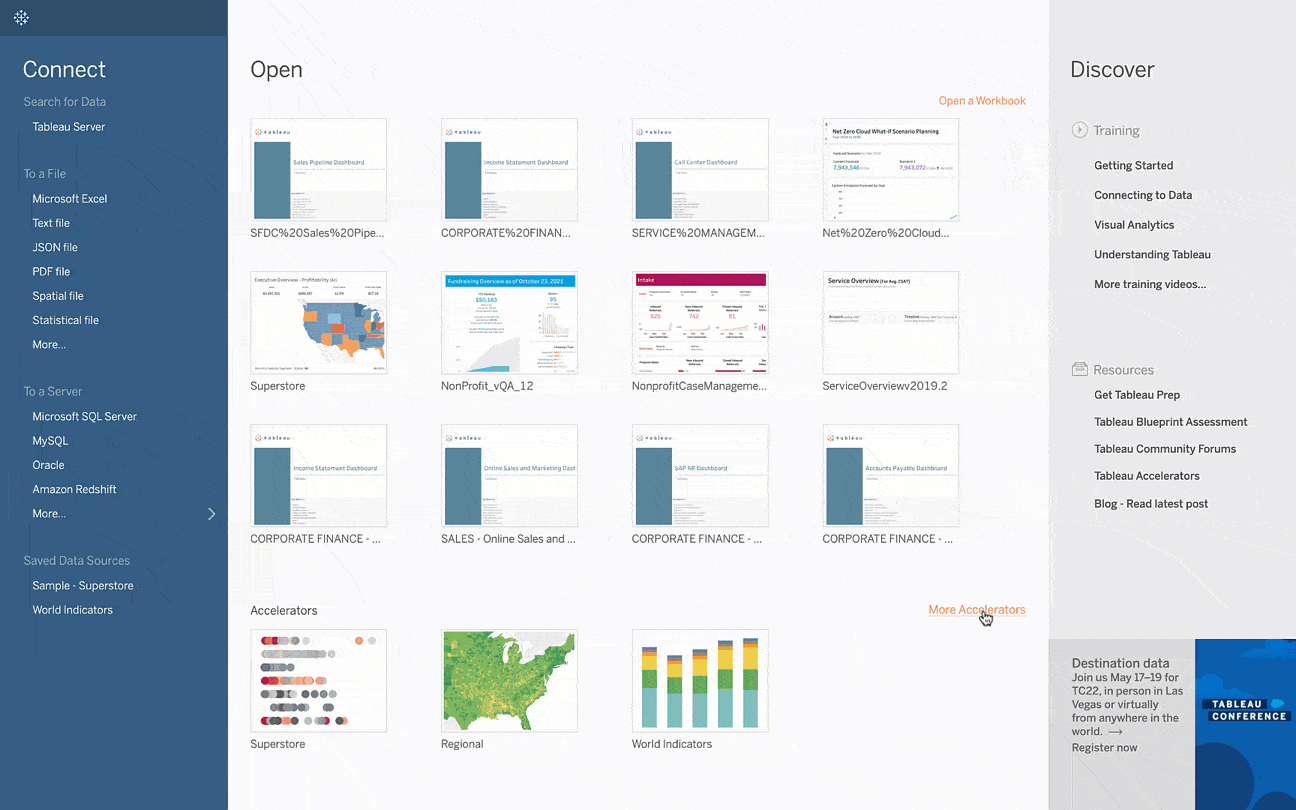
झांकी किसी को भी अपना डेटा देखने और समझने में मदद कर सकती है। विज़ुअलाइज़ेशन बनाने के लिए लगभग किसी भी डेटाबेस से कनेक्ट करें, खींचें और छोड़ें, और एक क्लिक के साथ साझा करें।

चाहे आप अपने संगठन में निर्णय ले रहे हों या अपने सॉफ़्टवेयर, ऐप या वेबसाइट में अंतर्दृष्टि एम्बेड कर रहे हों - ऐसे एनालिटिक्स सॉफ़्टवेयर चुनें, जो लोगों के सोचने के तरीके पर काम करता हो।

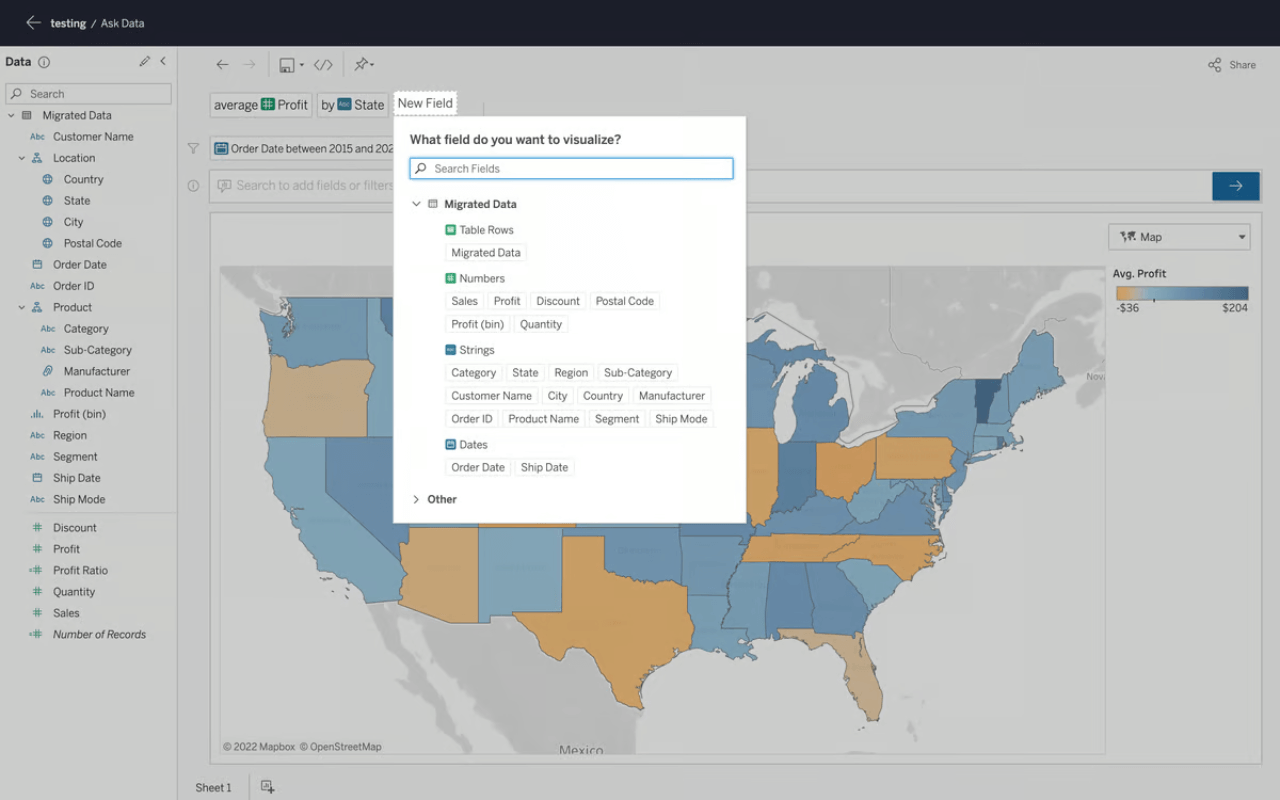
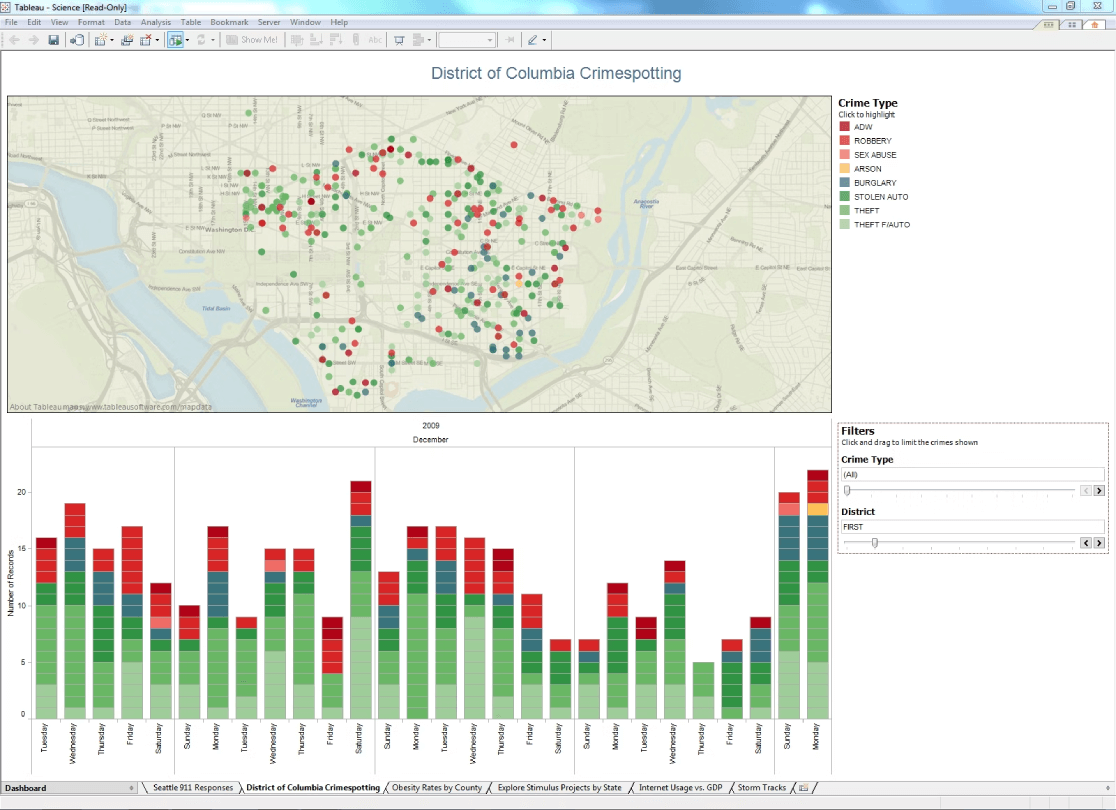
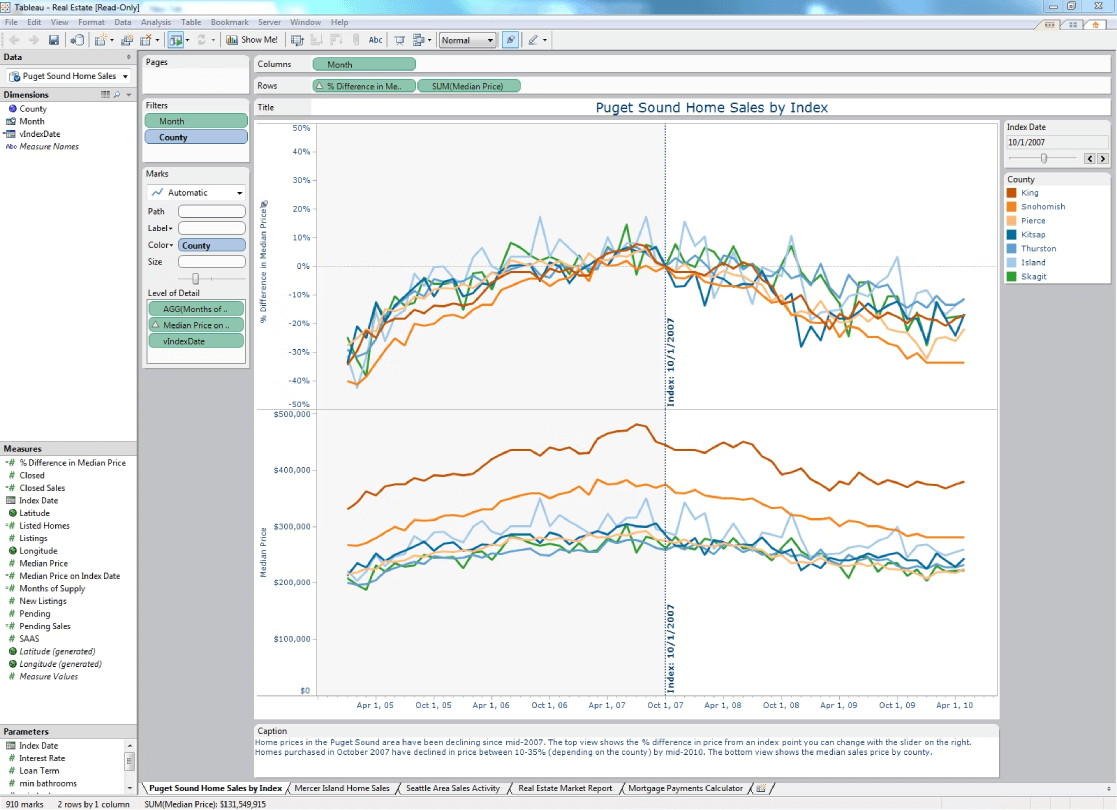
इसके अलावा झांकी पब्लिक के साथ आप इंटरेक्टिव चार्ट और ग्राफ, तेजस्वी मैप, लाइव डैशबोर्ड और मजेदार एप्लिकेशन को मिनटों में बना और साझा कर सकते हैं, फिर मुफ्त में वेब पर कहीं भी प्रकाशित कर सकते हैं।

Tableau विशेषताएँ

tick-square Time Series Analysis
tick-square Third Party Integrations
tick-square Territorial Mapping
tick-square Survival Analysis
tick-square Storytelling
tick-square Statistical Simulation
tick-square Statistical Process Control
tick-square Sensitive Data Identification
tick-square Self-service Analytics
tick-square Relational Display
tick-square Regression Analysis
tick-square Radial Mapping
tick-square Query Builder
tick-square Profitability Analysis
tick-square Predictive Analytics
tick-square OLAP
tick-square Natural Language Search
tick-square Multivariate Analysis
tick-square Multi-Language
tick-square Modeling & Simulation
tick-square Mobile Dashboards
tick-square Mixed Methods Research
tick-square Media Analytics
tick-square Master Data Management
tick-square Marketing Reports
tick-square Integration into Third Party Applications
tick-square Information Governance
tick-square High Volume Processing
tick-square For Science
tick-square For Education
tick-square Financial Reporting
tick-square Embeddable Maps
tick-square Element Analytics
tick-square ETL
tick-square Dynamic Content
tick-square Drag & Drop
tick-square Demand Forecasting
tick-square Database Support
tick-square Data Warehousing
tick-square Data Transformation
tick-square Data Quality Control
tick-square Data Integration
tick-square Data Import/Export
tick-square Data Dictionary Management
tick-square Data Coding
tick-square Data Cleansing
tick-square Data Capture and Transfer
tick-square Data Blending
tick-square Dashboard
tick-square Customizable Branding
tick-square Event Logs
tick-square Contextual Search
tick-square Categorization/Grouping
tick-square Authentication
tick-square Association Discovery
tick-square Ad hoc Analysis
tick-square AB Testing
tick-square Ad hoc Query
tick-square Public Dashboards
tick-square For Sales Teams/Organizations
tick-square Geographic Maps
tick-square Key Performance Indicators
tick-square Campaign Tracking
tick-square Visual Discovery
tick-square Trend/Problem Indicators
tick-square Single Page View
tick-square Scorecards
tick-square Scheduled/Automated Reports
tick-square Private Dashboards
tick-square KPI Monitoring
tick-square Functions/Calculations
tick-square Data Connectors
tick-square Benchmarking
tick-square Multi-Channel Attribution
tick-square Data Storage Management
tick-square Publishing/Sharing
tick-square Metadata Management
tick-square Text Analysis
tick-square Data Analysis Tools
tick-square Alerts/Escalation
tick-square Strategic Planning
tick-square Sentiment Analysis
tick-square ROI Tracking
tick-square Multi-Channel Data Collection
tick-square For Healthcare
tick-square User Research Analysis
tick-square Quantitative Analysis
tick-square Website Analytics
tick-square Qualitative Comparative Analysis
tick-square Heatmaps
tick-square Dashboard Creation
tick-square Forecasting
tick-square Annotations
tick-square Widgets
tick-square Data Mapping
tick-square Self Service Data Preparation
tick-square Data Discovery
tick-square AI/Machine Learning
tick-square Templates
tick-square Data Migration
tick-square Visual Analytics
tick-square Real Time Data
tick-square Data Visualization
tick-square Data Management
tick-square Trend Analysis
tick-square Statistical Analysis
tick-square Real Time Analytics
tick-square Data Security
tick-square API
tick-square Customizable Dashboard
tick-square Role-Based Permissions
tick-square Customizable Fields
tick-square Compliance Tracking
tick-square Collaboration Tools
tick-square Search/Filter
tick-square Sales Reports
tick-square Performance Metrics
tick-square Monitoring
tick-square Customizable Reports
tick-square Ad hoc Reporting
tick-square Activity Dashboard
tick-square Reporting & Statistics
tick-square Customer Database
tick-square Alerts/Notifications
tick-square Self Service Portal
tick-square Reporting/Analytics
tick-square Access Controls/Permissions
tick-square User Management
tick-square File Storage
tick-square Bayesian Analysis
tick-square Server Monitoring
tick-square Task Management
tick-square Performance Monitoring
tick-square Customer Journey Mapping
tick-square Behavioral Analytics

सर्वोत्तम विकल्प Tableau

सॉफ़्टवेयर के बारे में अपने विचार साझा करें, समीक्षा छोड़ें और इसे और बेहतर बनाने में मदद करें!

Tableau टैग

self-hosted-sync-server statistics data-visualization data-analysis business-intelligence big-data analytics

परिवर्तन सुझाएँ

आपकी प्रतिक्रिया

एक रेटिंग चुनें
कृपया एक रेटिंग चुनें

Your vote has been counted.

Do you have experience using this software?