Nós compilamos uma lista de 55 alternativas gratuitas e pagas para o AnyChart. Os principais concorrentes incluem: draw.io, Lucidchart. Além disso, os usuários também fazem comparações entre AnyChart e Asana, Matomo, MongoDB. Além disso, você pode conferir outras opções semelhantes aqui: Ferramentas de desenvolvimento.
Nós compilamos uma lista de 55 alternativas gratuitas e pagas para o AnyChart. Os principais concorrentes incluem: draw.io, Lucidchart. Além disso, os usuários também fazem comparações entre AnyChart e Asana, Matomo, MongoDB. Além disso, você pode conferir outras opções semelhantes aqui: Ferramentas de desenvolvimento.
Ferramenta de fluxogramas para programadores, administradores de rede, analistas de TI e designers, com funcionalidade de arrastar e largar para criação e publicação de diagramas.
O Asana é um software de gestão de projectos abrangente que permite às equipas gerir tarefas e projectos de forma eficiente. As suas funcionalidades incluem a criação e atribuição de tarefas, definição de prioridades, acompanhamento do progresso e a…
Simplifica a criação de diagramas online com a sua extensa biblioteca de modelos e interface de fácil utilização. Para processos complexos, estruturas organizacionais, mapas mentais e fluxogramas, promovendo a colaboração e a produtividade.
A SquaredUp é uma plataforma de visualização de dados que se integra com várias fontes de dados, incluindo repositórios de código e sistemas de interação com clientes, através de plugins ou de uma API Web. Permite que as equipas explorem, analisem e…
O ATLAS.ti é uma plataforma de análise de dados qualitativos concebida para extrair informações de diversos tipos de dados, incluindo texto, imagens e áudio. Oferece capacidades abrangentes de gestão, análise e colaboração de dados em plataformas Wi…
O Amazon Kinesis é um serviço de processamento de fluxo de dados totalmente gerido no AWS que recolhe, armazena em buffers e processa dados em tempo real, permitindo obter informações em minutos. Suporta aplicações de análise em tempo real, análise …
O TimeXtender é uma plataforma de integração de dados orientada por metadados e com pouco código que automatiza a ingestão, a preparação e a entrega de dados em plataformas de armazenamento. Simplifica os fluxos de trabalho, reduz a necessidade de c…
Flexible, cross-platform and cross-browser JavaScript (HTML5) charting library that allows you to...
Flexible, cross-platform and cross-browser JavaScript (HTML5) charting library that allows you to...
AnyChart Plataformas
iPhone
Linux
Mac
iPad
Android
Web-Based
Windows
AnyChart Vídeo e capturas de tela
AnyChart Visão geral
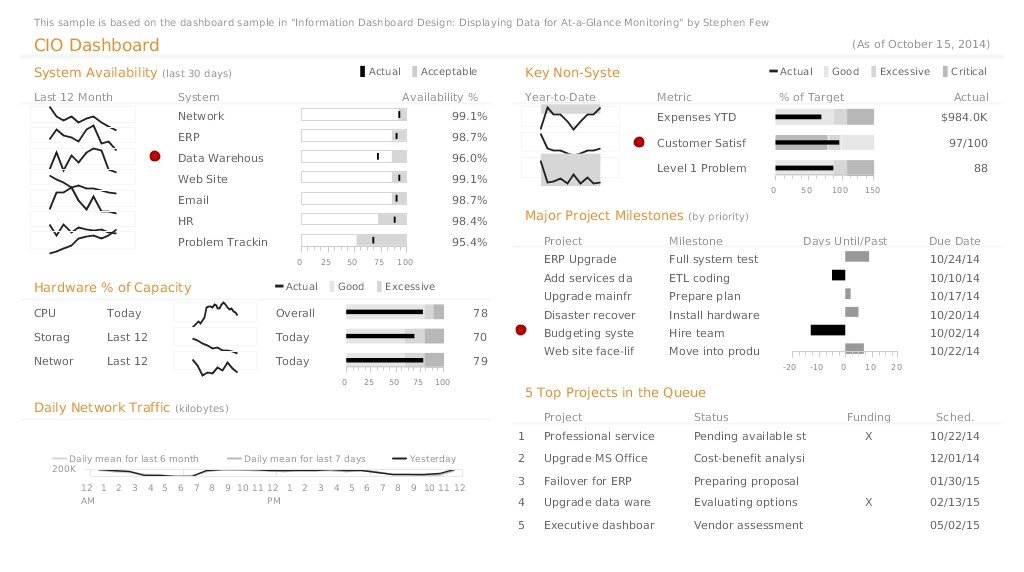
AnyChart is a flexible, cross-platform and cross-browser JavaScript charting library that allows you to create interactive HTML5 charts, stock charts, maps, Gantt charts, and dashboards for any project, in any browser, on any platform/OS.
AnyChart provides advanced customization and flexibility opportunities, no matter if you are developing a website, a BI app for corporate use, or software for your clients. The library's JavaScript API allows you to create even big data based charts in real time, with continuous updates, multi-level drill-downs. You can use any server platform or database, and you will get amazing informative visualization on all devices - Macs, laptops, PCs, smartphones, and tablets.
AnyChart has four main JavaScript/HTML5 charting solutions.
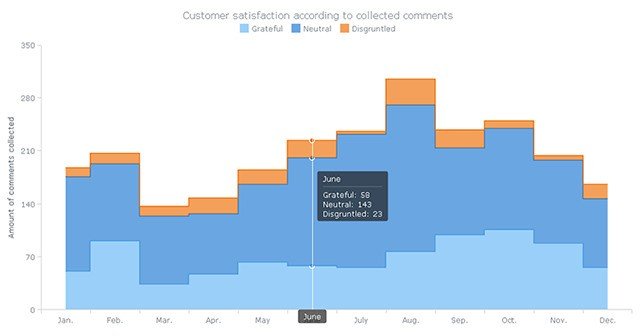
AnyChart JS Charts and Dashboards provides scatter, line, bar, area, waterfall, spline, funnel, bubble, polar, column, columnrange, pie, box plot, angular gauge, areasplinerange, and many other types of charts available separately and in combination, with single or multiple axes.
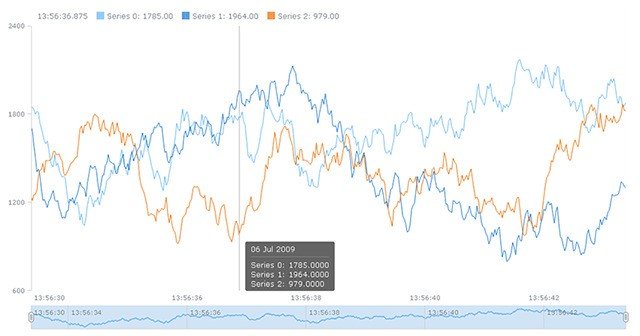
AnyStock Financial and Stock JS Charts converts any real-time data into sophisticated charts that can easily be made interactive. Scrolling, drill downs, zoom & panning make Reports and Dashboards greatly visualized to facilitate reviewing long-term and big data sets while analyzing Forex, commodity, investment, other market data.
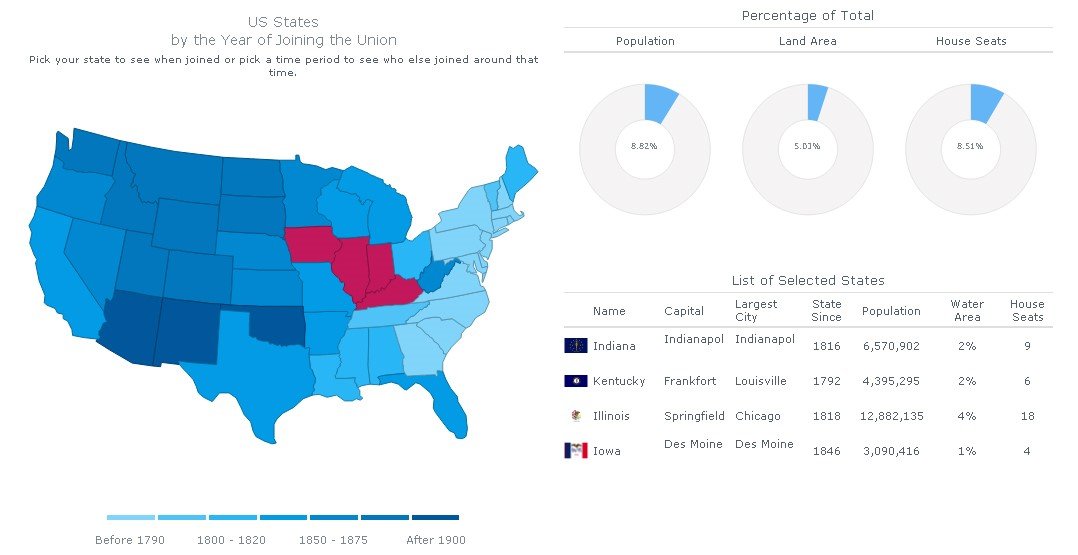
AnyMap JS Maps is perfect for dashboards and side-by-side reporting. This HTML5 mapping solution helps you build interactive maps for any browser on any platform. Use it to display sales by region, election results, population density, other geo-related data.
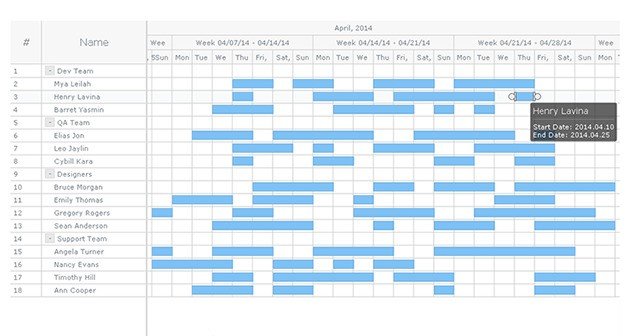
AnyGantt JS Project Charts allows you to utilize power of animation and ultimate interactivity to build complex and informative HTML5 Gantt, Resource and PERT charts, which can be used with ASP.NET, PHP, JSP, ColdFusion, Ruby on Rails or simple HTML pages to visualize data from any warehouse: text, Excel, CSV - MySQL, MS SQL, Oracle DB servers.