We've compiled a list of 50 free and paid alternatives to RAWGraphs. The primary competitors include Sisense, D3.js. In addition to these, users also draw comparisons between RAWGraphs and Tableau, CanvasJS Charts, Plotly. Also you can look at other similar options here: Development Tools.
We've compiled a list of 50 free and paid alternatives to RAWGraphs. The primary competitors include Sisense, D3.js. In addition to these, users also draw comparisons between RAWGraphs and Tableau, CanvasJS Charts, Plotly. Also you can look at other similar options here: Development Tools.
Business intelligence platform that provides data analytics and visualization solutions. It enables to analyze complex data sets and create interactive dashboards for better insights into their business performance. It also offers a range of feature…
Tableau is a powerful data visualization and business intelligence tool that allows you to analyze and visualize data in an interactive and meaningful way. It enables users to connect to various data sources, create dashboards, and share insights.
RAWGraphs is an open source app built with the goal of making the visualization of complex data...
RAWGraphs is an open source app built with the goal of making the visualization of complex data...
RAWGraphs Video and Screenshots
RAWGraphs Overview
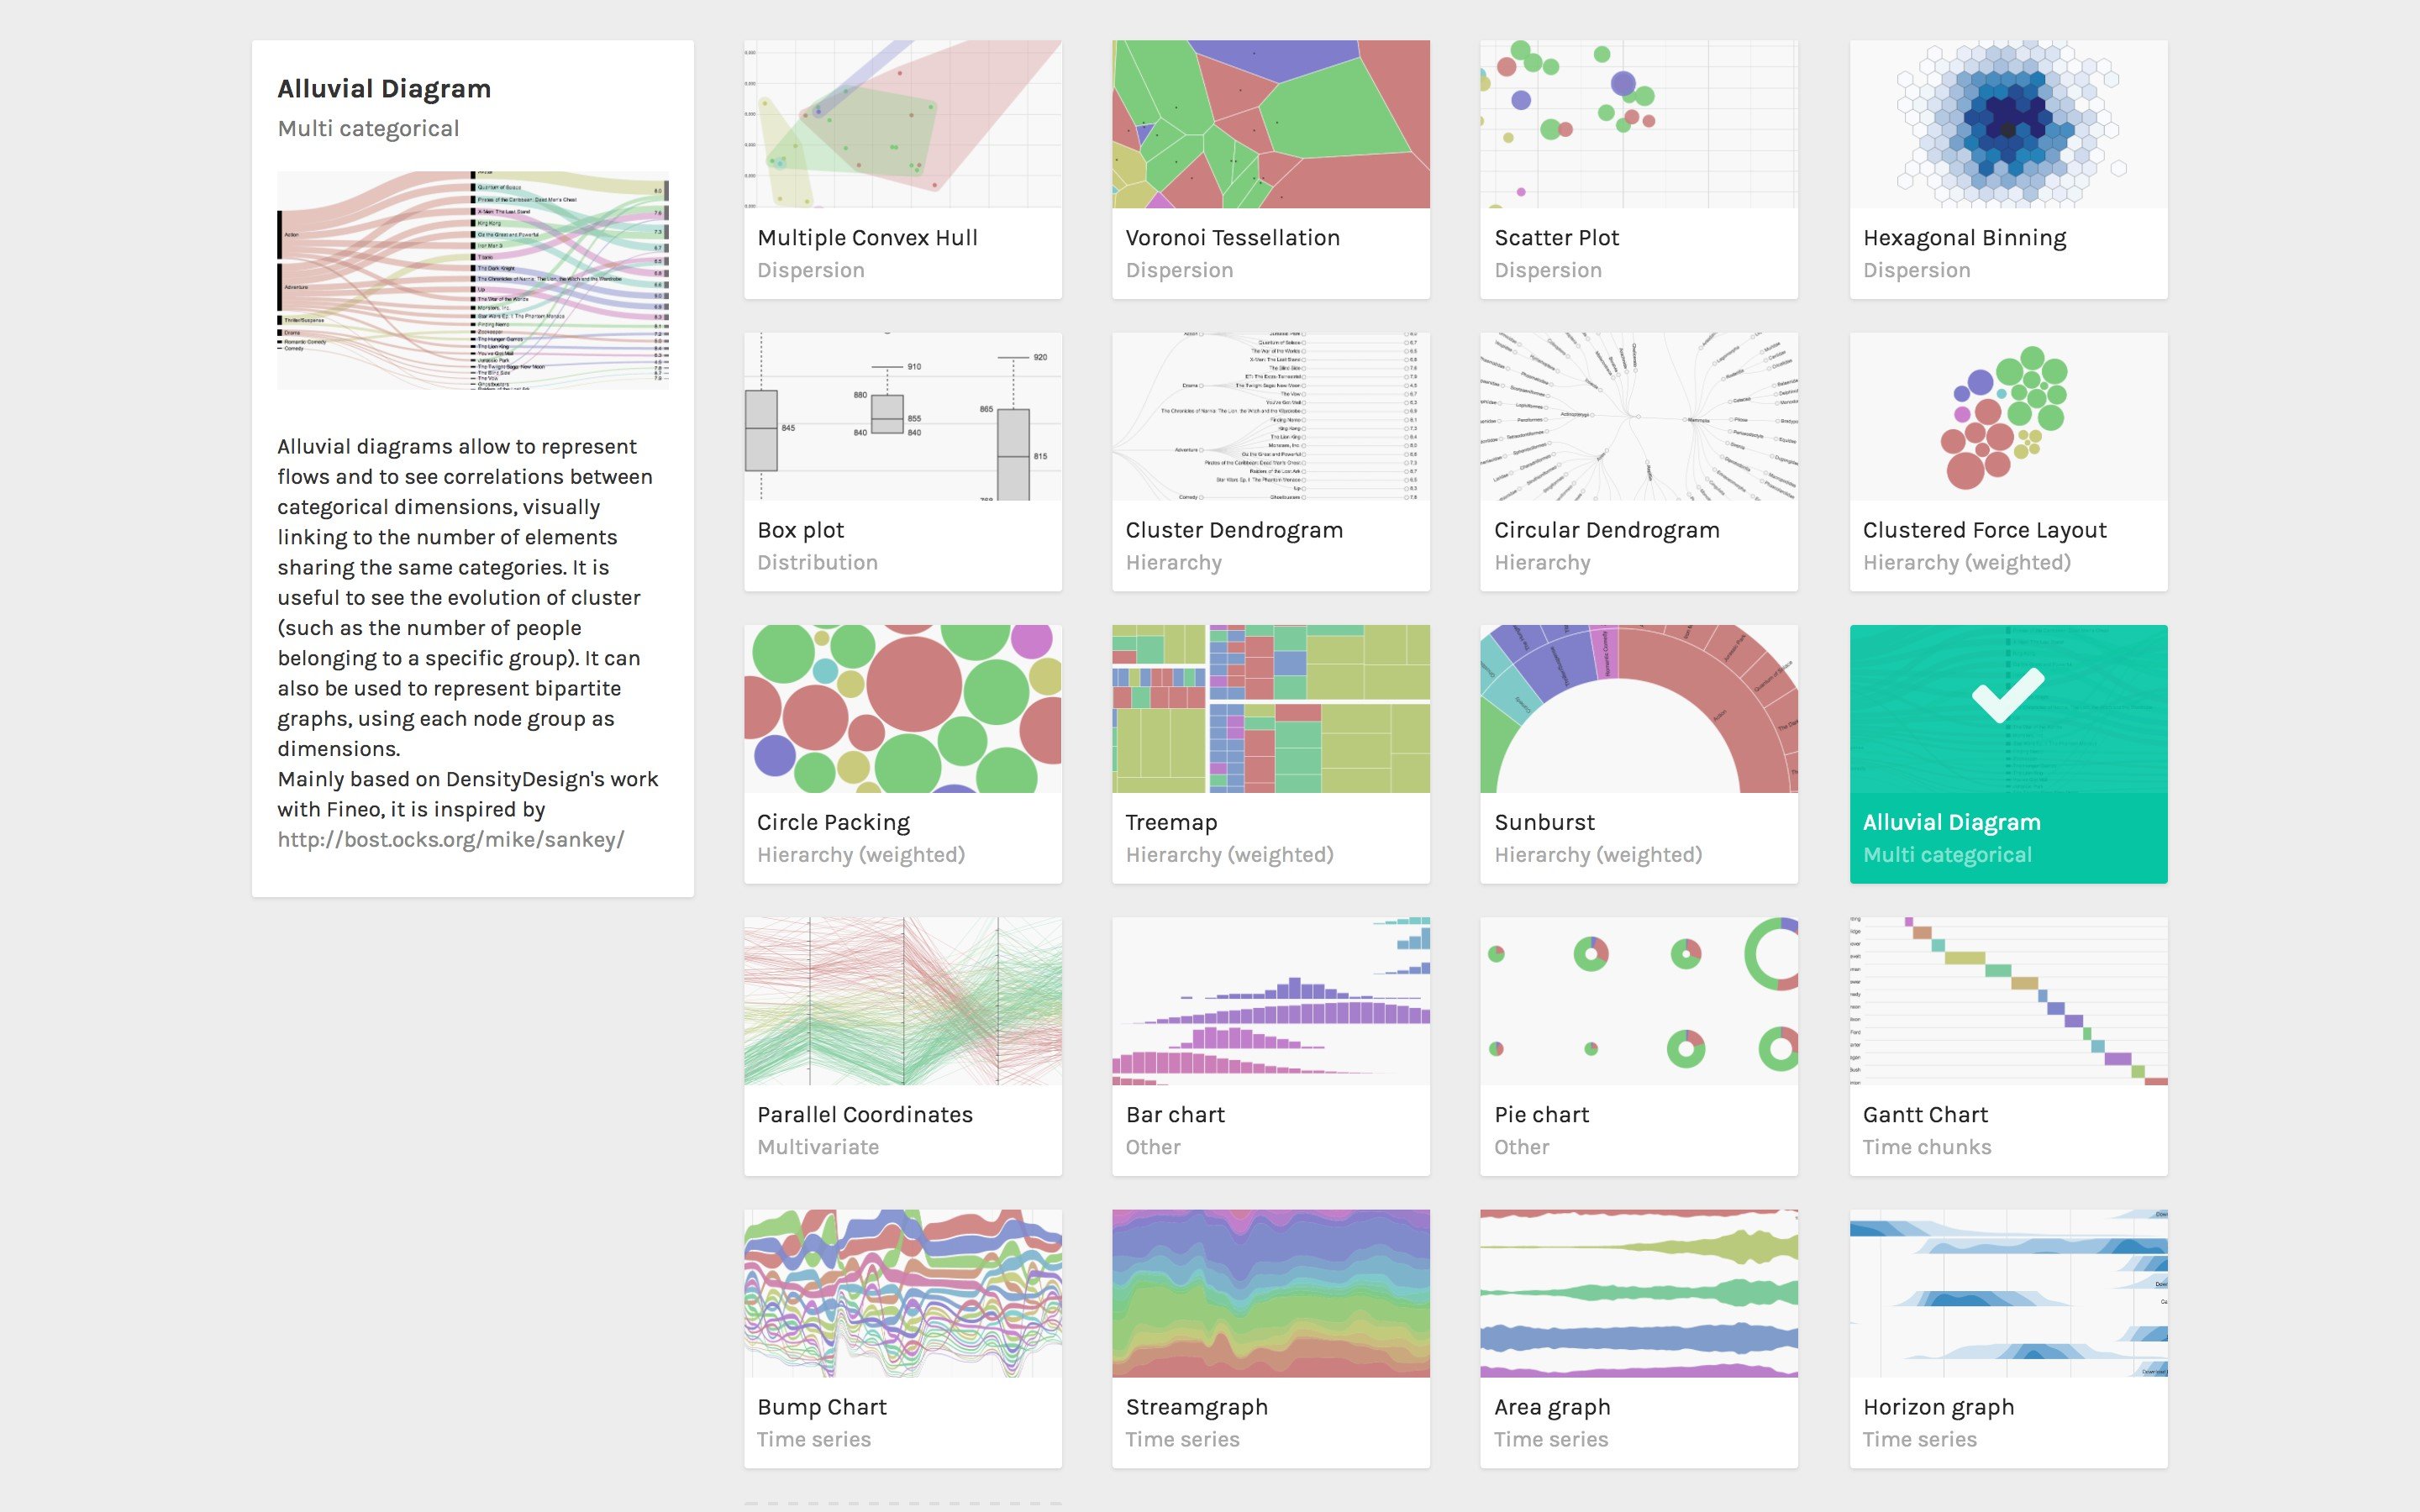
RAW Graphs is an open source data visualization framework built with the goal of making the visual representation of complex data easy for everyone.
Primarily conceived as a tool for designers and vis geeks, RAW Graphs aims at providing a missing link between spreadsheet applications (e.g. Microsoft Excel, Apple Numbers, OpenRefine) and vector graphics editors (e.g. Adobe Illustrator, Inkscape, Sketch).
The project, led and maintained by the DensityDesign Research Lab (Politecnico di Milano) was released publicly in 2013 and is regarded by many as one of the most important tools in the field of data visualization.
After a couple of years, the involvement of Contactlab as a funding partner brought the project to a new stage. DensityDesign and Calibro can now plan new releases and ways to involve the community.