We've compiled a list of 8 free and paid alternatives to OfficeReports. The primary competitors include RStudio, Minitab. In addition to these, users also draw comparisons between OfficeReports and IBM SPSS Statistics, Stata, PSPP. Also you can look at other similar options here: Online Services.
We've compiled a list of 8 free and paid alternatives to OfficeReports. The primary competitors include RStudio, Minitab. In addition to these, users also draw comparisons between OfficeReports and IBM SPSS Statistics, Stata, PSPP. Also you can look at other similar options here: Online Services.
Minitab, a robust statistical package, empowers users with diverse analyses: from descriptive stats, hypothesis tests, and regression analysis to ANOVA. Ideal for quality control, it enhances process quality through effective statistical methods.
IBM SPSS Statistics is a statistical data analysis software developed by IBM. It is used to process and analyze statistical data in various fields such as research, business, science, and social sciences.
Stata is a software product for statistical data analysis. It is widely used in research, social sciences, economics, and other fields. Stata allows you performin a variety of statistical analyses, including regression models, hypothesis testing, ti…
OfficeReports turns PowerPoint and Word into a complete data analysis and reporting suite for...
OfficeReports turns PowerPoint and Word into a complete data analysis and reporting suite for...
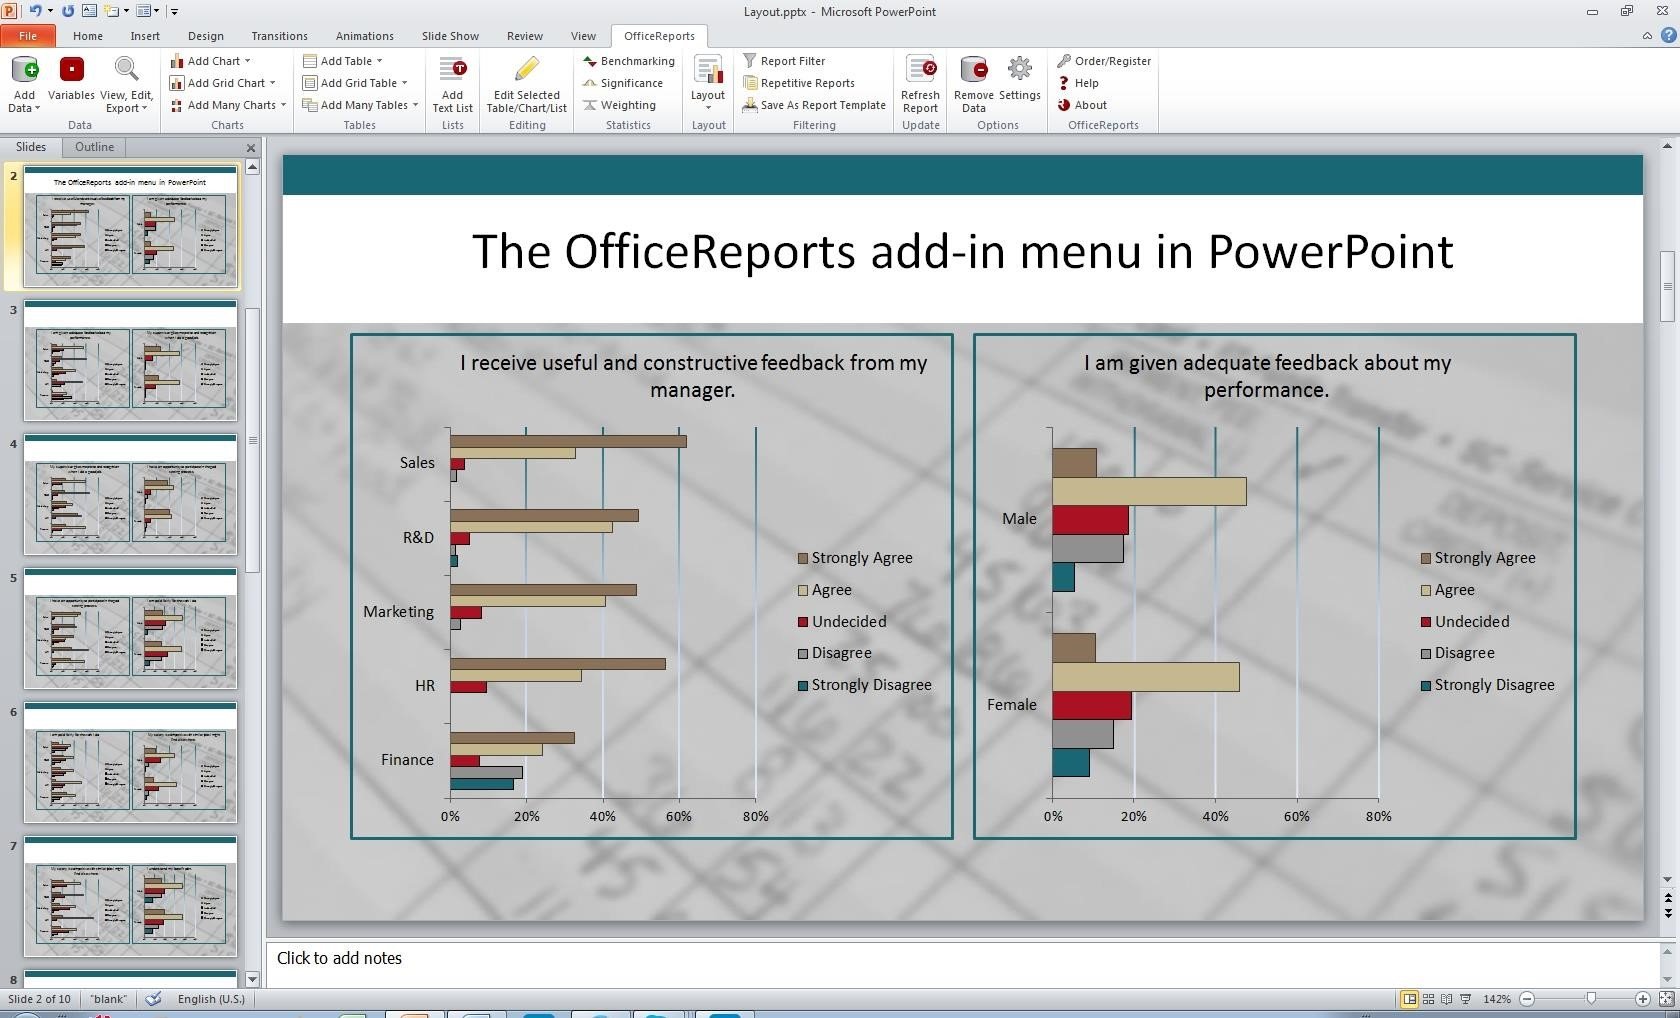
OfficeReports Video and Screenshots
OfficeReports Overview
OfficeReports turns PowerPoint and Word into a complete data analysis and reporting suite for surveys. Create crosstabs and charts and reuse your report.
The majority of all survey data ends as tables and charts in PowerPoint, but the process typically involves external analytical software to produce tables, Excel to do the layout, before the tables and charts finally can be copied to report in PowerPoint and Word. With the OfficeReports add-in for Microsoft Office you turn PowerPoint and Wort into analytical reporting tools. Add your raw data from common file formats as SPSS or Excel - or use the direct integration with SurveyMonkey - to add data directly to your PowerPoint and Word reports. The new OfficeReports menu added to PowerPoint and Word enables you to turn the data into tables and charts ready for presention. This video shows the concept in a nutshell: http://www.officereports.com/#what-is-officereports