Zabbix 대안
141141개의 무료 및 유료 대안을 Zabbix에 대한 목록으로 정리했습니다. 주요 경쟁 업체는 ownCloud, Wireshark입니다. 이 외에도 사용자들은 Zabbix와 Nagios, UptimeRobot, AppBeat 간에 비교를 하기도 합니다. 또한 여기서 다른 유사한 옵션을 살펴볼 수 있습니다: 시스템 및 하드웨어 도구.
141개의 무료 및 유료 대안을 Zabbix에 대한 목록으로 정리했습니다. 주요 경쟁 업체는 ownCloud, Wireshark입니다. 이 외에도 사용자들은 Zabbix와 Nagios, UptimeRobot, AppBeat 간에 비교를 하기도 합니다. 또한 여기서 다른 유사한 옵션을 살펴볼 수 있습니다: 시스템 및 하드웨어 도구.
141개의 무료 및 유료 대안을 Zabbix에 대한 목록으로 정리했습니다. 주요 경쟁 업체는 ownCloud, Wireshark입니다. 이 외에도 사용자들은 Zabbix와 Nagios, UptimeRobot, AppBeat 간에 비교를 하기도 합니다. 또한 여기서 다른 유사한 옵션을 살펴볼 수 있습니다: 시스템 및 하드웨어 도구.
모든 데이터를 안전하게 보관할 수있는 파일 – 일정, 연락처, 메일 등을 액세스하고 공유하십시오.
Nagios는 Nagios Enterprises에 따라 라이센스가 부여 된 강력한 모니터링 시스템으로 조직이 IT 인프라 문제를 식별하고 해결할 수 있도록 도와줍니다.
Dashboard with 50 Monitors, Checked Every 5 Minutes, Totally Free. Monitor HTTP(S), Ping, Port and check Keywords. Get alerted via e-mail, SMS, Twitter, web-hooks or push. View uptime, downtime and response times.
An uncompromising mature enterprise-level platform designed for real-time monitoring of millions of metrics collected from tens of thousands of servers, virtual machines and network devices, effortlessly scaling to even larger environments.
Gather and analyze accurate statistics and performance metrics, visualize it, get notified about current and potential issues without delay, and take advantage of our time-tested professional development and support.
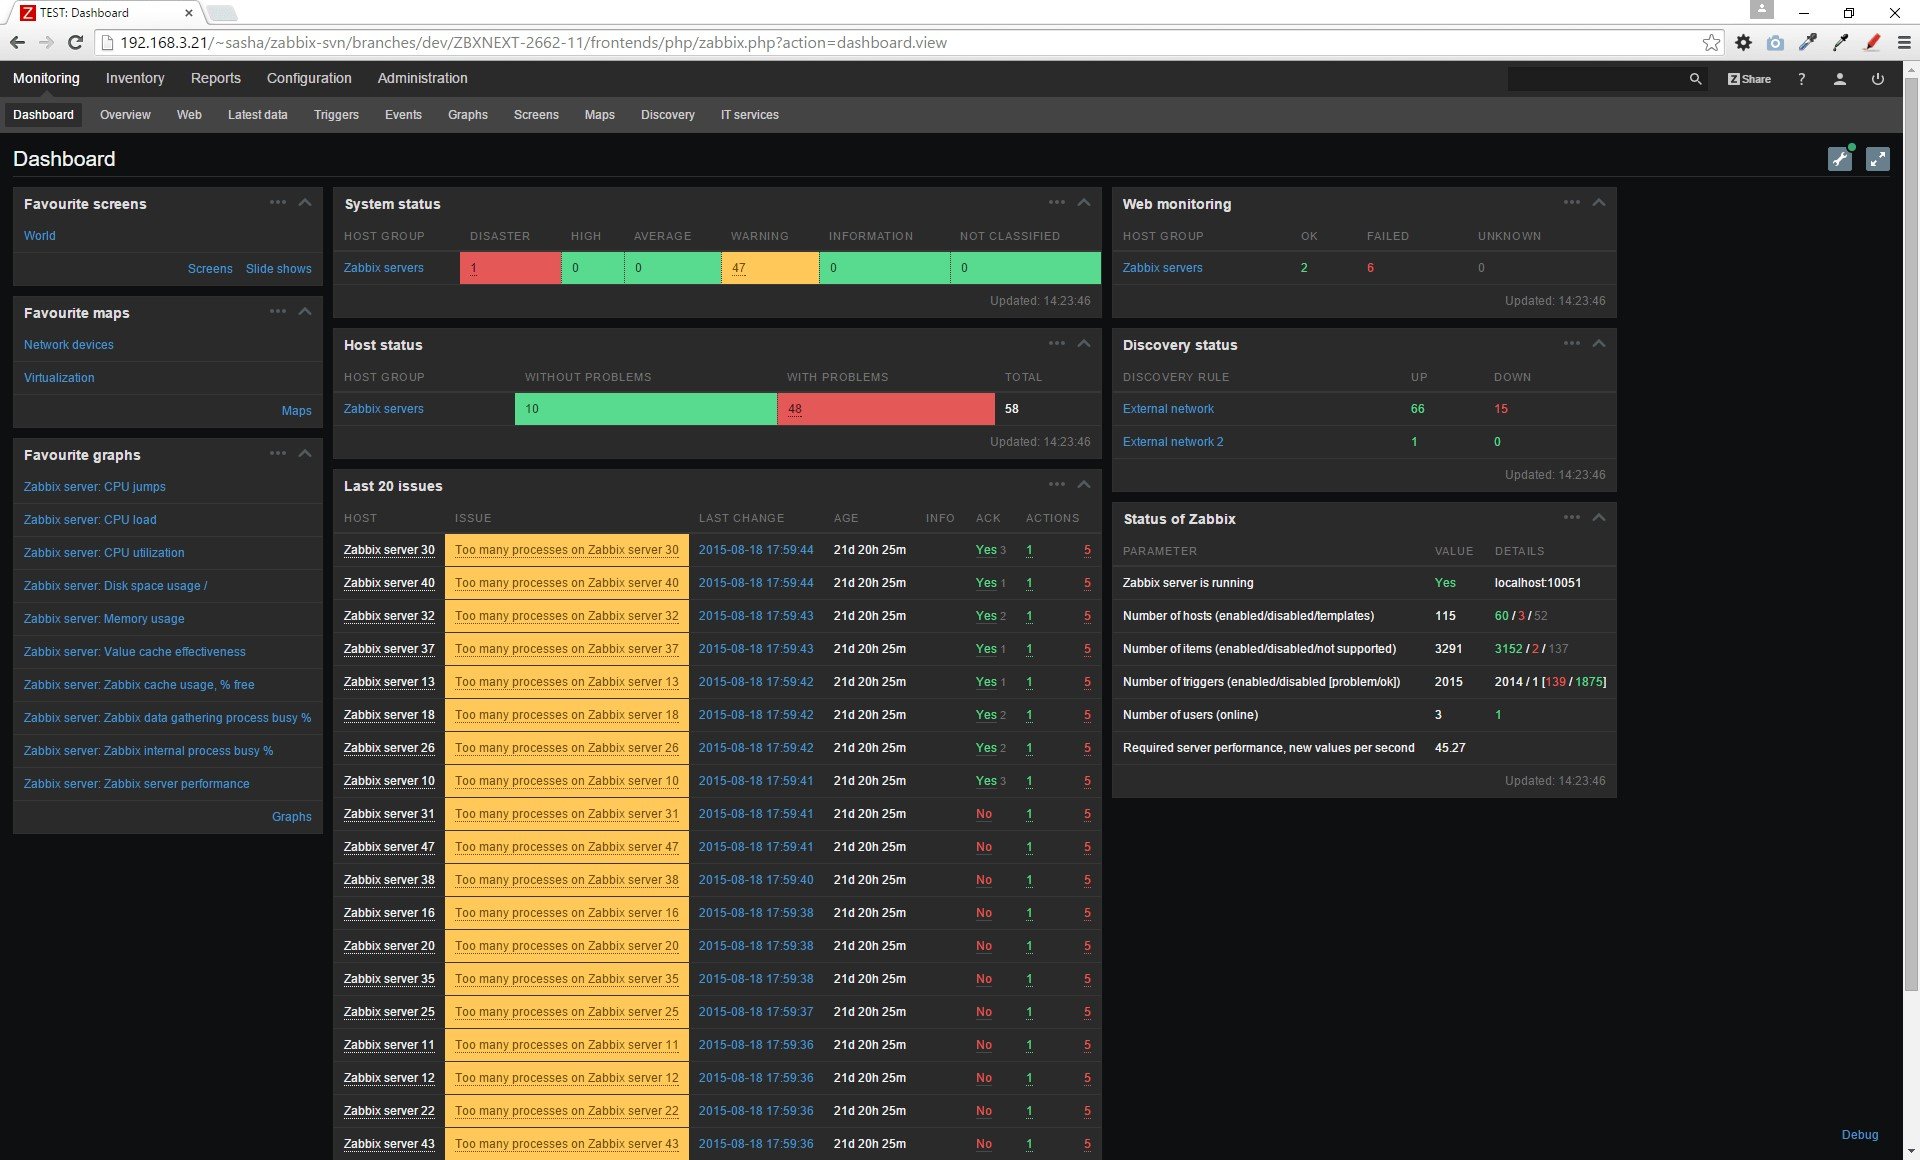
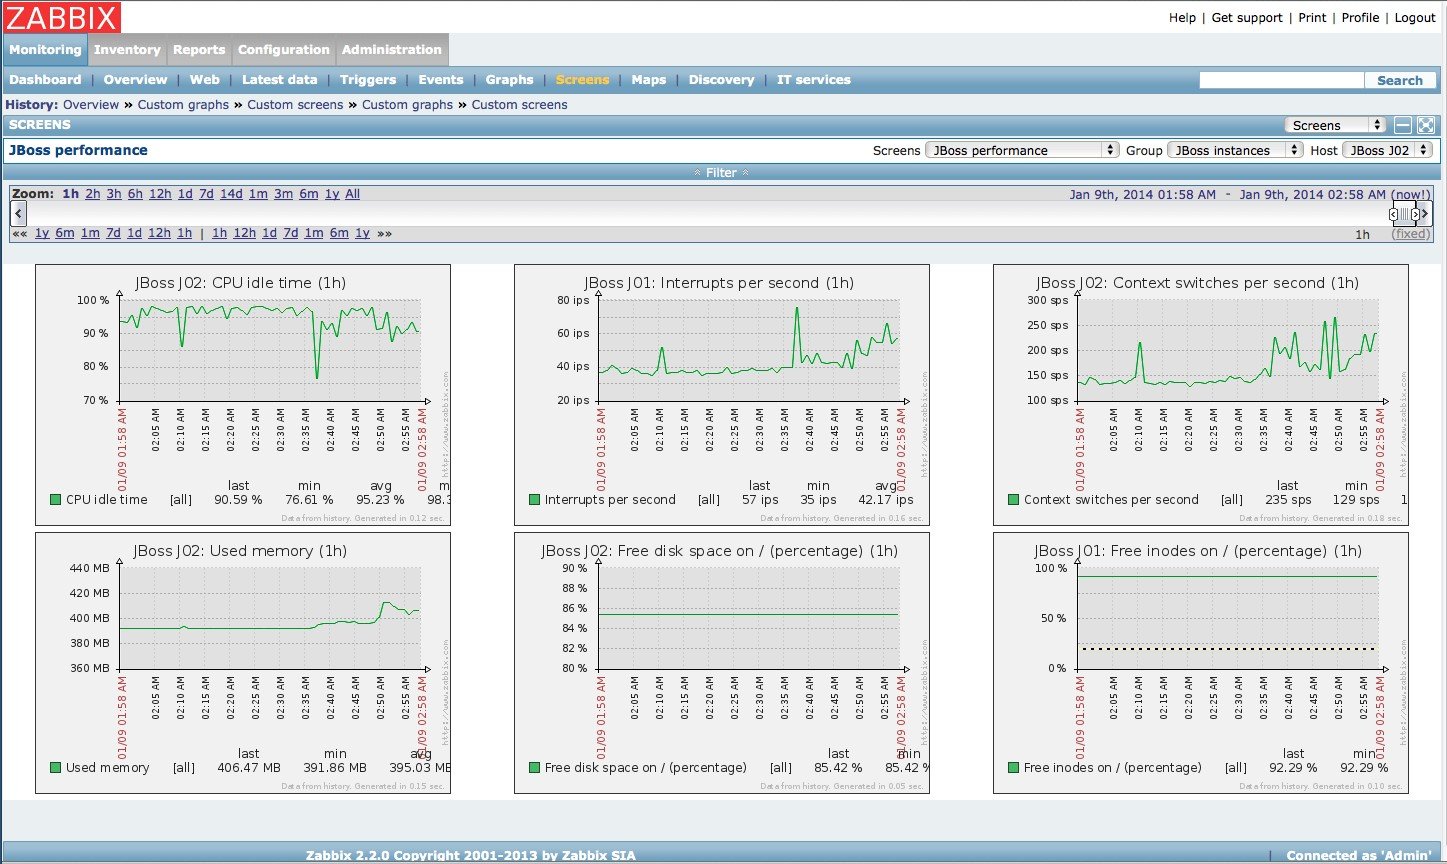
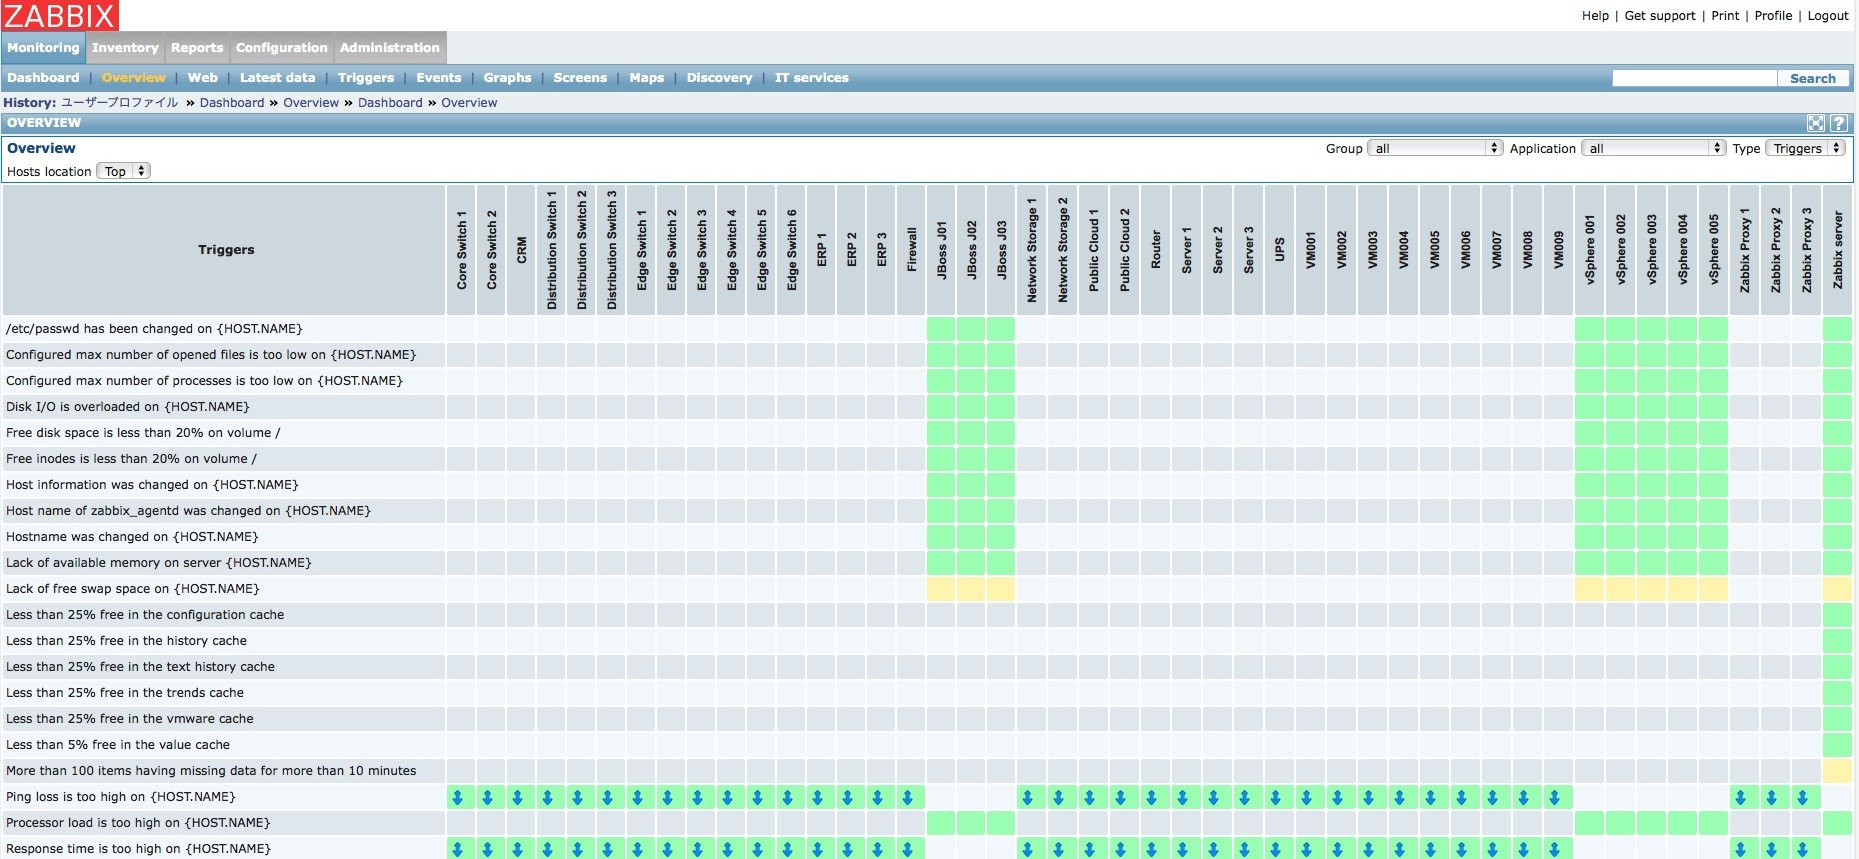
Along with storing the data, visualization features are available (overviews, maps, graphs, screens, etc), as well as very flexible ways of analyzing the data for the purpose of alerting.
Thresholds of acceptable limits for incoming data can be set. As soon as those thresholds are surpassed, Zabbix can deliver e-mail notifications informing network administrators about the current or a potential problem.
Zabbix offers great performance for data gathering and can be scaled to very large environments. Distributed monitoring options are available with the use of Zabbix proxies. Zabbix comes with a web-based interface, secure user authentication and a flexible user permission schema. Polling and trapping is supported, with native high performance agents gathering data from virtually any popular operating system; agent-less monitoring methods are available as well.
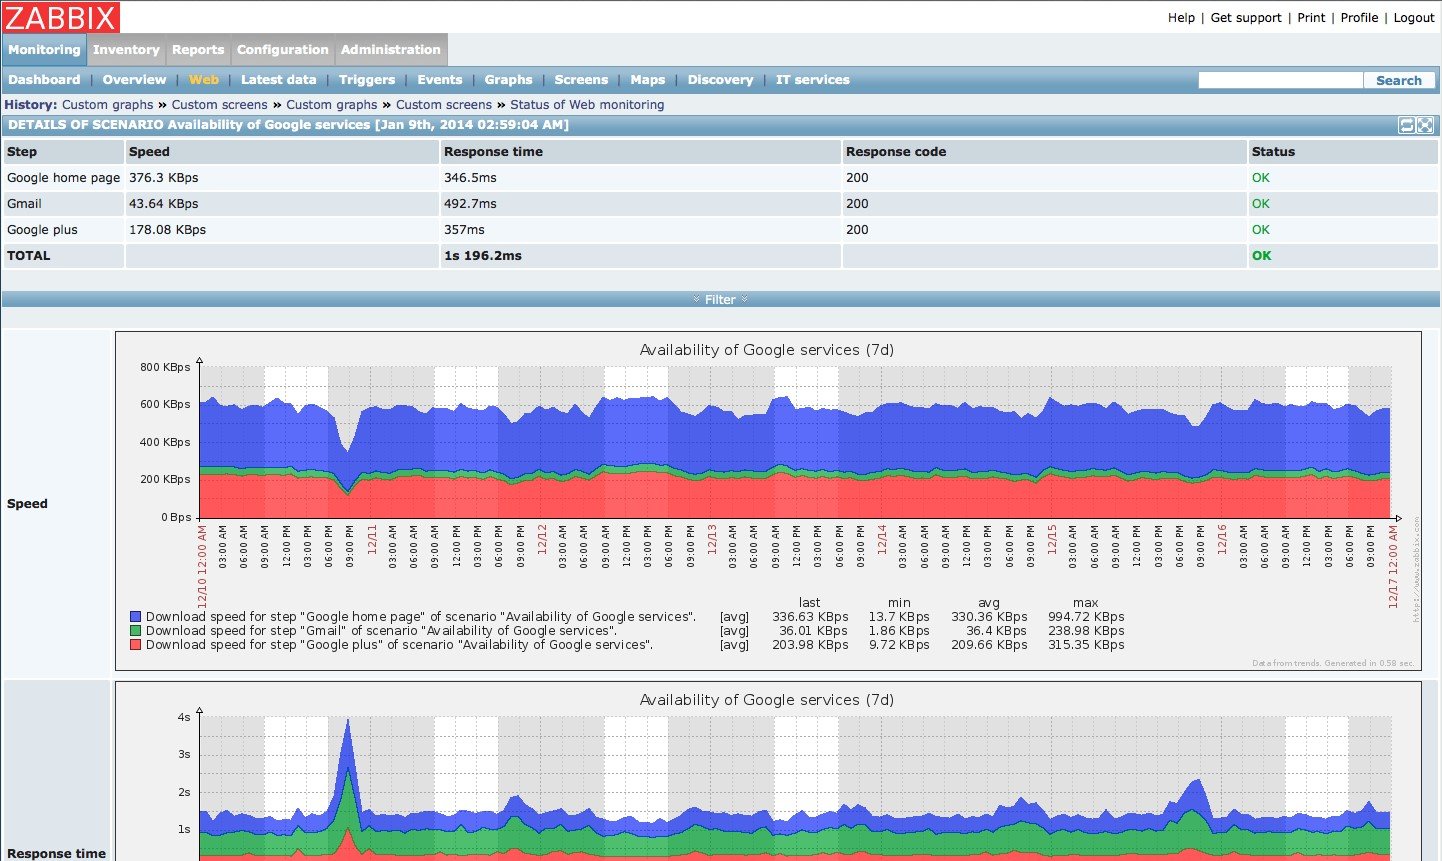
Web monitoring as well as monitoring of WMware virtual machines is possible with Zabbix. Zabbix can automatically discover network servers and devices, as well as perform low-level discovery with methods of automatically assigning performance and availability checks to discovered entities.
There are many reasons to choose the Zabbix solution over its competitors. The best way to make sure it is the #1 choice for your organization is to give it a try
소프트웨어에 대한 의견을 공유하고 리뷰를 남겨 더 나아지도록 도와주세요!
변경 제안
귀하의 의견
Your vote has been counted.
Do you have experience using this software?